Royston (Iceni) Weather Station
Daily Weather Observations - June 2000
| Date | Max | Min | Grass | Earth | Sunshine | Rainfall | Wind | Mean | Max | Cloud | Mean | Mean | Mean | Fog | Fog | Snow | Snow | Hail | Thunder | Date |
| Temp | Temp | Min | (30cm) | (Hrs) | (MM) | Direc- | Wind | Gust | Cover | MSL | Rel. | Temp | (vis.< | (vis.< | or | Lying | 00/00h | 00/00h | ||
| (°C) | (°C) | Temp | Temp | 00/00h | 09/09h | tion | Speed | Speed | (Oktas) | Pressure | Humd | (°C) | 1000m) | 200m | Rain/ | (>50% | ||||
| 09/09h | 09/09h | (°C) | (°C) | 09h | (mph) | (mph) | 09h | (mb) | (%) | 00/00h | 09h | 09h | Snow | cover | ||||||
| 09/09h | 09h | 00/00h | 00/00h | 00/00h | 00/00h | 00/00h | 09h) | |||||||||||||
| 1 | 18.0 | 11.2 | 10.5 | 15.3 | 4.17 | 0.0 | SW | 9.0 | 32 | 7 | 1014.5 | 87.2 | 14.4 | 0 | 0 | 0 | 0 | 0 | 0 | 1 |
| 2 | 19.5 | 12.1 | 10.8 | 15.5 | 1.43 | TR | SW | 5.1 | 21 | 7 | 1016.9 | 80.3 | 15.8 | 0 | 0 | 0 | 0 | 0 | 0 | 2 |
| 3 | 22.6 | 12.5 | 11.3 | 16.1 | 7.27 | 0.0 | S | 1.5 | 14 | 6 | 1015.7 | 74.2 | 17.7 | 0 | 0 | 0 | 0 | 0 | 0 | 3 |
| 4 | 19.1 | 11.1 | 9.0 | 17.5 | 7.49 | 0.0 | W | 4.6 | 23 | 2 | 1015.8 | 70.9 | 15.5 | 0 | 0 | 0 | 0 | 0 | 0 | 4 |
| 5 | 15.7 | 10.2 | 7.9 | 17.4 | 0.09 | 0.0 | NE | 1.1 | 12 | 8 | 1018.9 | 85.3 | 12.5 | 0 | 0 | 0 | 0 | 0 | 0 | 5 |
| 6 | 18.3 | 9.0 | 5.5 | 16.6 | 8.47 | 6.9 | W | 3.7 | 28 | 7 | 1019.4 | 77.9 | 12.9 | 0 | 0 | 0 | 0 | 1 | 1 | 6 |
| 7 | 20.2 | 7.8 | 5.0 | 16.4 | 12.22 | 0.0 | NW | 3.1 | 18 | 1 | 1022.9 | 64.1 | 14.5 | 0 | 0 | 0 | 0 | 0 | 0 | 7 |
| 8 | 20.7 | 10.1 | 7.8 | 17.4 | 10.07 | TR | S | 3.7 | 28 | 8 | 1014.0 | 65.3 | 16.5 | 0 | 0 | 0 | 0 | 0 | 0 | 8 |
| 9 | 19.8 | 13.4 | 9.9 | 17.7 | 5.50 | 6.3 | SE | 4.0 | 21 | 8 | 1008.2 | 84.0 | 16.1 | 0 | 0 | 0 | 0 | 0 | 0 | 9 |
| 10 | 20.0 | 8.6 | 5.5 | 16.9 | 13.35 | 0.0 | W | 4.2 | 21 | 5 | 1015.7 | 65.2 | 14.5 | 0 | 0 | 0 | 0 | 0 | 0 | 10 |
| 11 | 19.4 | 10.5 | 9.2 | 17.2 | 7.64 | 0.0 | W | 6.7 | 25 | 3 | 1017.7 | 66.7 | 14.7 | 0 | 0 | 0 | 0 | 0 | 0 | 11 |
| 12 | 25.5 | 11.4 | 10.1 | 17.4 | 14.04 | 0.0 | SW | 7.6 | 25 | 3 | 1022.4 | 72.2 | 18.7 | 0 | 0 | 0 | 0 | 0 | 0 | 12 |
| 13 | 22.6 | 14.6 | 13.0 | 18.5 | 4.60 | 0.0 | SW | 7.2 | 28 | 7 | 1023.0 | 73.0 | 18.0 | 0 | 0 | 0 | 0 | 0 | 0 | 13 |
| 14 | 21.5 | 13.2 | 12.3 | 18.5 | 0.13 | 0.1 | SW | 7.0 | 32 | 8 | 1022.2 | 79.4 | 16.7 | 0 | 0 | 0 | 0 | 0 | 0 | 14 |
| 15 | 22.4 | 13.5 | 12.5 | 18.0 | 8.65 | 0.0 | NW | 2.2 | 18 | 4 | 1024.7 | 69.0 | 17.2 | 0 | 0 | 0 | 0 | 0 | 0 | 15 |
| 16 | 20.6 | 11.4 | 10.2 | 18.5 | 4.32 | 0.0 | SE | 2.7 | 21 | 8 | 1027.0 | 79.4 | 15.6 | 0 | 0 | 0 | 0 | 0 | 0 | 16 |
| 17 | 26.3 | 12.0 | 10.7 | 18.3 | 15.06 | 0.0 | S | 4.8 | 25 | 0 | 1025.6 | 67.5 | 19.5 | 0 | 0 | 0 | 0 | 0 | 0 | 17 |
| 18 | 28.9 | 15.4 | 12.5 | 19.0 | 15.57 | 0.0 | S | 3.5 | 21 | 0 | 1020.9 | 57.3 | 22.3 | 0 | 0 | 0 | 0 | 0 | 0 | 18 |
| 19 | 32.0 | 17.0 | 15.1 | 19.9 | 13.47 | 0.0 | S | 5.8 | 23 | 0 | 1013.0 | 58.9 | 24.0 | 0 | 0 | 0 | 0 | 0 | 0 | 19 |
| 20 | 22.0 | 16.0 | 14.6 | 20.7 | 1.40 | 1.2 | SW | 3.3 | 18 | 8 | 1010.7 | 81.7 | 18.8 | 0 | 0 | 0 | 0 | 0 | 0 | 20 |
| 21 | 19.5 | 15.0 | 13.2 | 19.9 | 4.02 | TR | SW | 8.5 | 37 | 8 | 1007.7 | 75.5 | 16.6 | 0 | 0 | 0 | 0 | 0 | 0 | 21 |
| 22 | 18.3 | 12.0 | 10.1 | 18.8 | 4.84 | 2.2 | SW | 9.4 | 37 | 3 | 1009.0 | 80.2 | 14.7 | 0 | 0 | 0 | 0 | 0 | 0 | 22 |
| 23 | 18.4 | 12.5 | 10.7 | 18.3 | 1.48 | 0.0 | W | 5.4 | 25 | 8 | 1014.9 | 76.3 | 14.2 | 0 | 0 | 0 | 0 | 0 | 0 | 23 |
| 24 | 15.9 | 10.0 | 7.6 | 17.6 | 0.01 | TR | W | 4.9 | 23 | 8 | 1017.5 | 77.0 | 12.0 | 0 | 0 | 0 | 0 | 0 | 0 | 24 |
| 25 | 17.5 | 9.4 | 7.8 | 17.0 | 2.69 | 0.0 | N | 1.2 | 14 | 7 | 1022.0 | 76.6 | 12.9 | 0 | 0 | 0 | 0 | 0 | 0 | 25 |
| 26 | 19.5 | 8.9 | 6.9 | 17.4 | 5.51 | 0.0 | SE | 1.2 | 14 | 5 | 1024.9 | 71.6 | 14.0 | 0 | 0 | 0 | 0 | 0 | 0 | 26 |
| 27 | 22.4 | 10.6 | 9.5 | 17.3 | 8.91 | TR | SW | 2.3 | 14 | 0 | 1022.7 | 65.6 | 16.7 | 0 | 0 | 0 | 0 | 0 | 0 | 27 |
| 28 | 19.0 | 13.0 | 12.4 | 18.0 | 0.71 | TR | S | 1.8 | 14 | 8 | 1020.8 | 77.7 | 15.3 | 0 | 0 | 0 | 0 | 0 | 0 | 28 |
| 29 | 17.5 | 12.5 | 10.7 | 17.6 | 0.00 | 2.8 | N | 1.3 | 14 | 8 | 1020.0 | 86.2 | 14.3 | 0 | 0 | 0 | 0 | 0 | 0 | 29 |
| 30 | 17.4 | 11.1 | 11.0 | 17.5 | 0.64 | 0.2 | CALM | 0.7 | 14 | 8 | 1014.6 | 90.1 | 13.6 | 0 | 0 | 0 | 0 | 0 | 0 | 30 |
| Mean/ | 20.7 | 11.9 | 10.1 | 17.7 | 183.75 | 19.7 | X | 4.3 | X | 5.4 | 1018.1 | 74.5 | 16.0 | 0 | 0 | 0 | 0 | 1 | 1 | Mean/ |
| Total | (+1.0)* | (+1.7)* | (94%)* | (41%)* | Total |
Note re 24 Hour Temperature and Rainfall data read daily at 0900 GMT: Maximum temperature and rainfall are credited to the previous day; minimum temperature and grass minimum temperature are credited to the day of the reading.
* Monthly differences from average shown in red. The reference periods used are (i) Temperature 25 Years (1973/1997) (ii) Rainfall 35 Years (1961/1995) (iii) Sunshine 30 Years (1961/1990)
Click on the links below to access this month's graphs and charts......
1. Daily Maximum, Minimum and Grass Minimum Temperatures
2. Daily Maximum and Minimum Temperatures (with 25 Year Comparative Means)
3. Daily Earth Temperature @ 0900 GMT 4. Daily Rainfall 5. Daily Sunshine
6. Wind Speed 7. Wind Direction 8. Daily Mean MSL Air Pressure
9. Daily Mean Relative Humidity 10. Thermograph 11. Barograph 12. Hygrograph
13. Anemograph 14. Wind Direction (Graph) 15. Hyetograph
......and for a text report of the June 2000 weather in Royston click on the following link
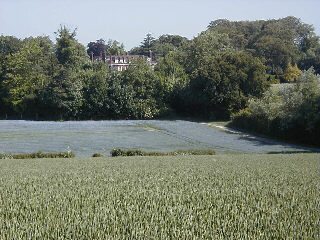
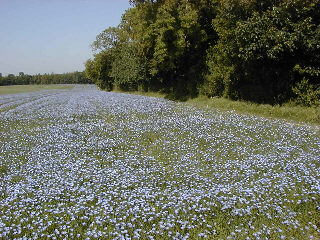
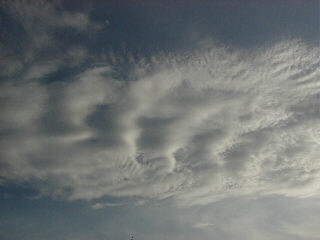
|
|
|
| The three photographs above were all taken on 19th June 2000 which was noteworthy for being the hottest day in Royston for almost 5 years, since 2nd August 1995, in fact. The temperature soared to a maximum of 32.0°C at 1315 GMT, which also made it the hottest June day since 28th June 1976 (see The incredible heatwave of 23rd June/8th July 1976). The first picture was taken just a few metres inside the western hemisphere on the Burloes Estate >>>>>>>>>> | at 0844 GMT, with the temperature already having risen to 25.5°C. The wind is SSW, mean wind speed 7 knots, gusting to 18 knots. The direction of view is approximately northwards along the line of the Greenwich Meridian, the nearest crop being wheat with a field of linseed behind. The expanses of bright yellow oilseed rape of late April/early May in the countryside around Royston have now >>>>>>>>>>> | been followed by patches of bright blue! The middle photograph is also of linseed, having been taken at 0853 GMT several hundred metres further west, and looking in a westerly direction towards the Barkway Road. The third photograph (taken at 1816 GMT) shows a curious formation of wave like cloud observed over Royston in the evening (when the temperature was still a very warm 26.4°C). The sunshine total for 19th June was 13.5 hours. |
Return to Welcome to Royston (Iceni) Weather Station page
(This page last updated 10th July 2000 1958 GMT)