Royston (Iceni) Weather Station
Daily Weather Observations - September 2001
| Date | Max | Min | Grass | Earth | Sunshine | Rainfall | Wind | Mean | Max | Cloud | Mean | Mean | Mean | Fog | Fog | Snow | Snow | Hail | Thunder | Date |
| Temp | Temp | Min | (30cm) | (Hrs) | (MM) | Direc- | Wind | Gust | Cover | MSL | Rel. | Temp | (vis.< | (vis.< | or | Lying | 00/00h | 00/00h | ||
| (°C) | (°C) | Temp | Temp | 00/00h | 09/09h | tion | Speed | Speed | (Oktas) | Pressure | Humd | (°C) | 1000m) | 200m | Rain/ | (>50% | ||||
| 09/09h | 09/09h | (°C) | (°C) | 09h | (mph) | (mph) | 09h | (mb) | (%) | 00/00h | 09h | 09h | Snow | cover | ||||||
| 09/09h | 09h | 00/00h | 00/00h | 00/00h | 00/00h | 00/00h | 09h) | |||||||||||||
| 1 | 19.5 | 10.6 | 9.1 | 17.5 | 7.32 | 0.0 | NW | 4.0 | 18 | 5 | 1018.0 | 76.4 | 15.1 | 0 | 0 | 0 | 0 | 0 | 0 | 1 |
| 2 | 20.5 | 15.6 | 14.5 | 17.6 | 0.83 | 1.0 | SW | 5.5 | 25 | 7 | 1013.0 | 83.6 | 17.9 | 0 | 0 | 0 | 0 | 0 | 0 | 2 |
| 3 | 20.1 | 12.5 | 12.1 | 17.8 | 3.82 | 8.0 | NW | 3.9 | 23 | 7 | 1011.3 | 77.2 | 15.0 | 0 | 0 | 0 | 0 | 0 | 0 | 3 |
| 4 | 17.4 | 9.8 | 8.6 | 17.5 | 8.05 | 0.0 | NW | 3.5 | 30 | 3 | 1016.0 | 73.8 | 12.4 | 0 | 0 | 0 | 0 | 0 | 1 | 4 |
| 5 | 17.6 | 8.4 | 5.1 | 16.7 | 2.07 | 10.4 | W | 4.1 | 18 | 7 | 1019.4 | 88.1 | 13.6 | 0 | 0 | 0 | 0 | 0 | 0 | 5 |
| 6 | 18.9 | 12.0 | 12.0 | 16.9 | 6.41 | 0.0 | NW | 4.0 | 21 | 2 | 1016.2 | 78.4 | 14.8 | 0 | 0 | 0 | 0 | 0 | 0 | 6 |
| 7 | 19.1 | 11.3 | 9.5 | 17.0 | 1.00 | TR | W | 8.5 | 32 | 8 | 1014.8 | 76.1 | 15.7 | 0 | 0 | 0 | 0 | 0 | 0 | 7 |
| 8 | 18.5 | 12.9 | 11.8 | 17.0 | 5.70 | 0.0 | NW | 6.5 | 32 | 4 | 1012.9 | 69.9 | 14.3 | 0 | 0 | 0 | 0 | 0 | 0 | 8 |
| 9 | 15.5 | 7.0 | 5.1 | 16.4 | 5.22 | 0.1 | NW | 5.6 | 30 | 0 | 1017.8 | 71.1 | 10.9 | 0 | 0 | 0 | 0 | 0 | 0 | 9 |
| 10 | 16.4 | 7.1 | 5.0 | 15.6 | 8.36 | 0.1 | NW | 4.1 | 25 | 3 | 1019.1 | 69.3 | 11.1 | 0 | 0 | 0 | 0 | 0 | 0 | 10 |
| 11 | 18.0 | 9.4 | 7.2 | 15.4 | 0.94 | TR | W | 3.3 | 18 | 8 | 1018.0 | 80.7 | 14.1 | 0 | 0 | 0 | 0 | 0 | 0 | 11 |
| 12 | 19.6 | 11.6 | 9.7 | 15.5 | 1.98 | 2.3 | SW | 6.3 | 32 | 8 | 1012.4 | 81.0 | 14.7 | 0 | 0 | 0 | 0 | 0 | 0 | 12 |
| 13 | 15.9 | 9.5 | 7.8 | 15.5 | 3.45 | 2.9 | SW | 6.3 | 30 | 7 | 1001.3 | 85.3 | 11.5 | 0 | 0 | 0 | 0 | 0 | 0 | 13 |
| 14 | 18.1 | 8.3 | 7.0 | 14.9 | 5.95 | 0.0 | W | 4.1 | 21 | 5 | 1009.3 | 78.8 | 12.6 | 0 | 0 | 0 | 0 | 0 | 0 | 14 |
| 15 | 17.0 | 9.6 | 7.9 | 14.9 | 5.33 | 0.5 | NW | 6.8 | 32 | 4 | 1010.8 | 73.7 | 12.4 | 0 | 0 | 0 | 0 | 0 | 0 | 15 |
| 16 | 16.8 | 7.3 | 5.6 | 14.6 | 7.29 | 0.1 | NW | 3.6 | 25 | 0 | 1017.7 | 77.0 | 11.0 | 0 | 0 | 0 | 0 | 0 | 0 | 16 |
| 17 | 13.6 | 6.3 | 4.2 | 14.3 | 1.29 | 4.0 | NW | 5.0 | 30 | 8 | 1020.0 | 90.0 | 9.7 | 0 | 0 | 0 | 0 | 0 | 0 | 17 |
| 18 | 14.0 | 10.1 | 9.8 | 14.0 | 0.00 | 8.6 | NE | 5.4 | 28 | 8 | 1014.6 | 99.1 | 12.2 | 0 | 0 | 0 | 0 | 0 | 0 | 18 |
| 19 | 14.8 | 11.3 | 11.1 | 14.0 | 0.07 | 2.7 | N | 6.9 | 32 | 8 | 1006.3 | 96.8 | 12.3 | 0 | 0 | 0 | 0 | 0 | 0 | 19 |
| 20 | 17.0 | 11.4 | 10.9 | 14.2 | 0.57 | 3.3 | NW | 1.2 | 16 | 8 | 1013.1 | 95.0 | 12.4 | 0 | 0 | 0 | 0 | 0 | 0 | 20 |
| 21 | 15.9 | 7.5 | 4.8 | 14.3 | 4.81 | 0.0 | NW | 0.8 | 14 | 4 | 1017.7 | 89.1 | 11.0 | 0 | 0 | 0 | 0 | 0 | 0 | 21 |
| 22 | 16.5 | 6.6 | 4.9 | 14.4 | 4.06 | 0.0 | CALM | 0.2 | 12 | 8 | 1016.9 | 90.3 | 9.9 | 1 | 1 | 0 | 0 | 0 | 0 | 22 |
| 23 | 14.4 | 6.7 | 4.0 | 14.0 | 0.00 | 4.8 | N | 2.4 | 21 | 8 | 1013.1 | 95.7 | 11.2 | 0 | 0 | 0 | 0 | 0 | 0 | 23 |
| 24 | 17.8 | 10.1 | 8.5 | 14.0 | 4.34 | 1.6 | CALM | 0.3 | 12 | 6 | 1012.3 | 91.9 | 11.8 | 0 | 0 | 0 | 0 | 0 | 0 | 24 |
| 25 | 15.6 | 8.4 | 5.6 | 14.0 | 3.59 | 0.0 | CALM | 0.4 | 14 | 8 | 1015.7 | 92.7 | 11.0 | 1 | 0 | 0 | 0 | 0 | 0 | 25 |
| 26 | 17.2 | 9.9 | 6.6 | 14.0 | 4.06 | 0.9 | SE | 1.7 | 16 | 3 | 1013.9 | 90.6 | 12.7 | 0 | 0 | 0 | 0 | 0 | 0 | 26 |
| 27 | 19.5 | 12.0 | 9.5 | 14.1 | 3.43 | 0.0 | SW | 4.9 | 30 | 8 | 1011.2 | 90.3 | 15.4 | 0 | 0 | 0 | 0 | 0 | 0 | 27 |
| 28 | 22.0 | 12.0 | 11.1 | 14.6 | 10.44 | 13.0 | SE | 3.8 | 28 | 3 | 1009.4 | 83.3 | 16.5 | 0 | 0 | 0 | 0 | 0 | 0 | 28 |
| 29 | 18.1 | 14.7 | 12.5 | 15.0 | 1.79 | 1.3 | S | 3.2 | 18 | 8 | 1006.4 | 94.8 | 15.2 | 0 | 0 | 0 | 0 | 0 | 0 | 29 |
| 30 | 16.5 | 12.1 | 10.7 | 14.8 | 0.02 | 3.4 | S | 7.9 | 35 | 8 | 1003.1 | 96.0 | 14.8 | 0 | 0 | 0 | 0 | 0 | 0 | 30 |
| Mean/Total | 17.4 | 10.1 | 8.4 | 15.4 | 112.19 | 69.0 | X | 4.2 | X | 5.8 | 1013.4 | 84.6 | 13.1 | 2 | 1 | 0 | 0 | 0 | 1 | Mean/Total |
| (-1.2) | (-0.3) | (78%) | (121%) |
Differences from average:
Differences from average shown in red. Reference periods used are as follows: Temperature 25 Years 1973/1997; rainfall 30 Years 1971/2000; sunshine 30 Years 1961/1990.
Observations practice:
Note: In line with standard meteorological practice the 24 hour maximum temperature and rainfall are read at 0900 GMT and credited to the previous day i.e. data shown above for 1st actually read at 0900 GMT on 2nd and represents the previous 24 hours. The 24 hour minimum and grass minimum temperatures are similarly observed at 0900 GMT but are credited to the day of the reading (e.g. observations made at 0900 GMT on 2nd shown against 2nd and represent previous 24 hours). This is the reason why at daily update of the above table the minimum and grass minimum temperatures appear to be "ahead" of the other data mentioned. (This explanation given in response to a query received).
Graphs and Charts:
Click on the links below to view this month's graphs and charts......
1. Daily Maximum, Minimum, & Grass Minimum Temperatures
2. Daily Maximum & Minimum Temperatures (with 25 Year Comparative Means)
3. Daily Earth (30 cms depth) Temperature @ 0900 GMT 4. Daily Rainfall 5. Daily Sunshine
6. Daily Maximum Gust & Mean Wind Speed 7. Daily Wind Direction @ 0900 GMT
8. Daily Mean MSL Air Pressure 9. Daily Mean Relative Humidity
10. Thermograph 11. Barograph 12. Hygrograph 13. Anemograph 14. Wind Direction
15. Sunshine Duration 16. Rainfall Intensity & Duration
September 2001 Weather Review:
A text report of the September 2001 weather in Royston may be viewed by clicking on the link below.....
September (since 1972) at Royston (Iceni) Weather Station:
Mean day maximum temperature (25 years 1973/1997) 18.6°C
Mean night minimum temperature (25 years 1973/1997) 10.4°C
Highest temperature 29.6°C (5th September 1973); lowest temperature 2.0°C (22nd September 1979)
Lowest grass minimum temperature -1.4°C (30th September 1988)
Hottest September 1999 (Mean temperature 17.0°C); coolest September 1972 (Mean temperature 12.0°C)
Average September rainfall (30 years 1971/2000) 57.2 mm
Wettest September 1995 (Rainfall 138.7 mm); driest September 1996 (Rainfall 11.8 mm)
Wettest Day 22nd September 1992 (Rainfall 78.1 mm);
Highest number of "rain days" (0.2 mm or more) 21 (1974, 1995); lowest number of "rain days" 5 (1986)
Highest number of days with thunder 6 (1984)
|
|
|
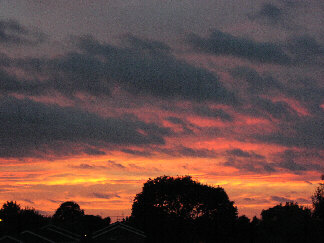
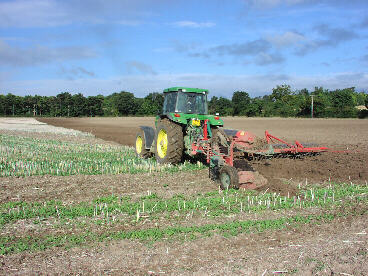
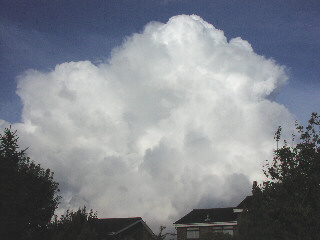
| This sunset was viewed from Royston at 1850 GMT on 7th September 2001. As can be seen, the vivid colouring was confined to fairly near the horizon and occurred after a mainly cloudy day which accumulated only 1.0 hours sunshine. It was a windy day also, and at sunset it was still rather windy with a mean wind speed of 9 knots, gusting to 22 knots (wind direction WSW). The maximum temperature for the day was 17.5°C, some 3°C below average. | The remnants of the oilseed rape crop are disappearing as this field at Lowerfield to the east of Royston is going under the plough in early morning sunshine at 0815 GMT on 3rd September 2001. The tractor here is facing a westerly wind of mean speed 3 knots, gusting to 10 knots in a temperature of 15°C (after an overnight minimum of 12.5°C). The maximum temperature achieved that day was 20.1°C (at 1230 GMT). Sunshine for the day was 3.8 hours, followed by overnight rainfall of 8.0 millimetres. | This spectacular cumulo-nimbus shower cloud bubbled up to the east of Royston in the late afternoon of 24th September 2001. A feature of the day had been the stillness of the air for much of the time, it being dead calm when this photograph was taken at 1630 GMT. Although Royston was threatened by towering cumulo-nimbus clouds at times during the day only two relatively minor showers occurred, yielding 1.6 millimetres rainfall. The sunshine total for the day was 4.3 hours, and the maximum temperature was 17.8°C. |
Return to Welcome to Royston (Iceni) Weather Station page
(This page last updated 13th October 2001 1958 GMT)