Royston (Iceni) Weather Station
Daily
Weather Observations -
January
2002
| Date |
Max |
Min |
Grass |
Earth |
Sunshine |
Rainfall |
Wind |
Mean |
Max |
Cloud |
Mean |
Mean |
Mean |
Fog |
Fog |
Snow |
Snow |
Hail |
Thunder |
Date |
| |
Temp |
Temp |
Min
|
(30cm) |
(Hrs) |
(MM) |
Direc- |
Wind |
Gust |
Cover |
MSL |
Rel. |
Temp |
(vis.< |
(vis.<
|
or
|
Lying |
00/00h |
00/00h |
|
| |
(°C) |
(°C) |
Temp |
Temp |
00/00h |
09/09h |
tion |
Speed |
Speed |
(Oktas) |
Pressure |
Humd |
(°C) |
1000m) |
200m |
Rain/
|
(>50% |
|
|
|
| |
09/09h |
09/09h |
(°C) |
(°C) |
|
|
09h |
(mph) |
(mph) |
09h |
(mb) |
(%) |
00/00h |
09h |
09h |
Snow |
cover |
|
|
| |
|
|
09/09h |
09h |
|
|
|
00/00h |
00/00h |
|
00/00h |
00/00h |
|
|
|
00/00h |
09h) |
|
|
|
| |
|
|
|
|
|
|
|
|
|
|
|
|
|
|
|
|
|
|
|
|
| 1 |
3.9 |
-3.2 |
-7.7 |
2.5 |
6.59 |
0.0 |
SW |
1.6 |
14 |
0 |
1038.5 |
88.2 |
-1.3 |
0 |
0 |
0 |
0 |
0 |
0 |
1 |
| 2 |
2.2 |
-3.4 |
-7.9 |
2.3 |
6.64 |
0.0 |
SE |
3.3 |
25 |
1 |
1032.2 |
89.7 |
-0.9 |
0 |
0 |
0 |
0 |
0 |
0 |
2 |
| 3 |
3.4 |
-0.3 |
-3.1 |
2.0 |
6.93 |
0.0 |
SE |
3.6 |
30 |
1 |
1028.7 |
88.4 |
0.5 |
0 |
0 |
0 |
0 |
0 |
0 |
3 |
| 4 |
4.9 |
-3.5 |
-6.0 |
2.0 |
6.76 |
0.1 |
SE |
2.6 |
18 |
0 |
1029.3 |
87.6 |
-1.0 |
0 |
0 |
0 |
0 |
0 |
0 |
4 |
| 5 |
7.1 |
1.0 |
0.6 |
1.9 |
0.00 |
0.5 |
S |
5.6 |
18 |
8 |
1034.9 |
99.3 |
4.9 |
0 |
0 |
0 |
0 |
0 |
0 |
5 |
| 6 |
6.7 |
3.9 |
3.1 |
1.9 |
0.00 |
0.3 |
W |
0.9 |
12 |
8 |
1036.8 |
99.2 |
5.2 |
1 |
1 |
0 |
0 |
0 |
0 |
6 |
| 7 |
5.4 |
4.0 |
3.0 |
2.0 |
0.00 |
0.1 |
S |
0.5 |
9 |
8 |
1035.0 |
96.5 |
4.2 |
0 |
0 |
0 |
0 |
0 |
0 |
7 |
| 8 |
3.5 |
2.4 |
0.0 |
2.6 |
0.00 |
TR |
CALM |
0.1 |
9 |
8 |
1033.7 |
92.3 |
2.6 |
0 |
0 |
0 |
0 |
0 |
0 |
8 |
| 9 |
4.6 |
0.5 |
-2.0 |
2.9 |
4.79 |
0.1 |
CALM |
2.3 |
18 |
0 |
1034.5 |
94.1 |
2.0 |
0 |
0 |
0 |
0 |
0 |
0 |
9 |
| 10 |
5.5 |
2.5 |
1.4 |
3.0 |
0.60 |
2.9 |
SE |
1.2 |
14 |
8 |
1029.9 |
97.1 |
3.8 |
1 |
0 |
0 |
0 |
0 |
0 |
10 |
| 11 |
6.1 |
1.1 |
0.4 |
3.5 |
3.03 |
0.1 |
W |
4.6 |
23 |
8 |
1028.9 |
96.4 |
2.5 |
0 |
0 |
0 |
0 |
0 |
0 |
11 |
| 12 |
8.0 |
3.6 |
2.2 |
3.6 |
3.26 |
0.0 |
S |
6.3 |
28 |
3 |
1028.8 |
95.9 |
5.1 |
0 |
0 |
0 |
0 |
0 |
0 |
12 |
| 13 |
10.0 |
6.0 |
5.0 |
4.1 |
0.10 |
0.0 |
S |
5.7 |
25 |
8 |
1023.7 |
98.1 |
7.7 |
0 |
0 |
0 |
0 |
0 |
0 |
13 |
| 14 |
9.9 |
8.4 |
7.4 |
5.0 |
0.20 |
1.3 |
SW |
6.1 |
25 |
8 |
1021.8 |
95.3 |
8.9 |
0 |
0 |
0 |
0 |
0 |
0 |
14 |
| 15 |
8.8 |
7.0 |
5.5 |
5.7 |
1.91 |
0.0 |
W |
4.5 |
18 |
8 |
1015.9 |
91.9 |
6.2 |
0 |
0 |
0 |
0 |
0 |
0 |
15 |
| 16 |
8.5 |
2.0 |
-1.0 |
5.1 |
1.66 |
0.0 |
SW |
6.5 |
23 |
5 |
1020.4 |
91.0 |
4.6 |
0 |
0 |
0 |
0 |
0 |
0 |
16 |
| 17 |
9.3 |
7.5 |
6.1 |
5.1 |
0.00 |
4.2 |
SW |
6.5 |
35 |
8 |
1016.0 |
94.2 |
7.3 |
0 |
0 |
0 |
0 |
0 |
0 |
17 |
| 18 |
8.5 |
1.9 |
-0.1 |
5.2 |
3.47 |
0.5 |
S |
6.8 |
32 |
1 |
1016.1 |
92.9 |
4.5 |
0 |
0 |
0 |
0 |
0 |
0 |
18 |
| 19 |
10.3 |
5.9 |
3.1 |
5.0 |
7.17 |
0.0 |
SW |
10.4 |
32 |
0 |
1011.2 |
84.9 |
6.7 |
0 |
0 |
0 |
0 |
0 |
0 |
19 |
| 20 |
13.0 |
5.5 |
3.9 |
5.0 |
0.00 |
0.3 |
SW |
13.2 |
44 |
8 |
1009.6 |
91.4 |
9.8 |
0 |
0 |
0 |
0 |
0 |
0 |
20 |
| 21 |
12.3 |
11.5 |
10.5 |
6.1 |
0.08 |
0.0 |
SW |
10.7 |
37 |
8 |
1006.7 |
88.9 |
10.7 |
0 |
0 |
0 |
0 |
0 |
0 |
21 |
| 22 |
9.5 |
7.9 |
6.2 |
6.5 |
4.63 |
1.4 |
SW |
10.1 |
37 |
7 |
1001.8 |
83.5 |
7.7 |
0 |
0 |
0 |
0 |
0 |
0 |
22 |
| 23 |
11.1 |
6.5 |
4.9 |
6.3 |
0.14 |
4.2 |
S |
9.5 |
37 |
8 |
989.8 |
92.3 |
8.8 |
0 |
0 |
0 |
0 |
0 |
0 |
23 |
| 24 |
9.1 |
8.0 |
5.8 |
6.8 |
0.33 |
0.1 |
W |
8.4 |
39 |
8 |
996.8 |
83.4 |
6.8 |
0 |
0 |
0 |
0 |
0 |
0 |
24 |
| 25 |
11.4 |
1.6 |
-1.6 |
6.1 |
0.00 |
5.2 |
S |
8.2 |
46 |
8 |
1011.0 |
90.1 |
5.5 |
0 |
0 |
0 |
0 |
0 |
0 |
25 |
| 26 |
11.1 |
8.4 |
6.4 |
6.4 |
0.11 |
7.2 |
SW |
14.0 |
51 |
8 |
999.2 |
89.4 |
9.5 |
0 |
0 |
0 |
0 |
0 |
0 |
26 |
| 27 |
13.5 |
7.2 |
5.5 |
6.9 |
0.00 |
1.4 |
S |
9.1 |
41 |
8 |
1003.3 |
92.4 |
9.7 |
0 |
0 |
0 |
0 |
0 |
0 |
27 |
| 28 |
11.5 |
9.9 |
7.5 |
7.5 |
5.28 |
TR |
SW |
16.5 |
58 |
3 |
1011.3 |
78.7 |
10.2 |
0 |
0 |
0 |
0 |
0 |
0 |
28 |
| 29 |
13.0 |
7.8 |
5.4 |
7.1 |
2.12 |
0.0 |
SW |
10.2 |
41 |
5 |
1018.8 |
85.3 |
9.8 |
0 |
0 |
0 |
0 |
0 |
0 |
29 |
| 30 |
12.4 |
8.9 |
7.2 |
7.3 |
0.01 |
2.1 |
SW |
9.2 |
35 |
8 |
1011.6 |
91.8 |
10.0 |
0 |
0 |
0 |
0 |
0 |
0 |
30 |
| 31 |
11.3 |
4.7 |
2.7 |
7.5 |
2.18 |
1.2 |
SW |
11.7 |
46 |
6 |
1010.6 |
84.3 |
7.6 |
0 |
0 |
0 |
0 |
0 |
0 |
31 |
| |
|
|
|
|
|
|
|
|
|
|
|
|
|
|
|
|
|
|
|
|
| Mean/Total |
8.6 |
4.4 |
2.4 |
4.7 |
67.99 |
33.2 |
X |
6.8 |
X |
5.7 |
1018.9 |
91.1 |
5.8 |
2 |
1 |
0 |
0 |
0 |
0 |
Mean/Total |
| |
(+2.2) |
(+2.5) |
|
|
(125%) |
(65%) |
|
|
|
|
|
|
|
|
|
|
|
|
|
|
(*All
times GMT*)
Additional
Data:
Rainfall Duration 44.5 hours; Air Frost Duration 40.6 hours.
Differences
from average:
Differences
from average shown in red. Reference
periods used are as follows: Temperature 25 Years
1973/1997; rainfall 30 Years
1971/2000; sunshine 30 Years
1961/1990.
Observations
practice:
Note: In
line with standard meteorological practice the 24 hour maximum
temperature and rainfall
are read at 0900 GMT and credited to the previous
day i.e. data shown above for 1st
actually read at 0900 GMT on 2nd
and represents the previous 24 hours. The 24 hour minimum
and grass minimum temperatures
are similarly observed at 0900 GMT but are credited to the day
of the reading (e.g. observations made at 0900
GMT on 2nd shown against 2nd
and represent previous 24 hours). This is the
reason why at daily update of the above table the minimum and
grass minimum temperatures appear to be "ahead" of the
other data mentioned. (This explanation given in response to a
query received).
Graphs
and Charts:
Click on
the links below to view this months graphs and charts.......
1. Daily Maximum, Minimum & Grass Minimum
Temperatures
2. Daily
Maximum & Minimum Temperatures (with 25 Year Comparative
Means)
3. Daily Earth (30 cms Depth) Temperature @
0900 GMT 4. Daily Rainfall 5. Daily Sunshine
6. Daily Maximum Gust & Mean Wind Speed 7. Daily Wind Direction @ 0900 GMT
8. Daily Mean MSL Air Pressure 9. Daily Mean Relative Humidity
10. Thermograph 11. Barograph 12. Hygrograph 13. Anemograph
14. Wind Direction 15. Sunshine Duration 16. Rainfall Intensity & Duration
January
2002 Weather Review:
....and
click on the following link for a text report of the January 2002
weather in Royston
January 2002
Weather Review
January
(since 1973) at Royston (Iceni) Weather Station:
Mean day maximum temperature (25
years 1973/1997) 6.4°C
Mean night minimum temperature
(25 years 1973/1997) 1.9°C
Highest temperature 14.2°C (6th January 1999); lowest temperature -12.7°C (14th January 1982)
Lowest grass minimum
temperature -18.1°C (10th January 1982)
Warmest January 1983, 1990 (Mean temperature 6.9°C); coldest January 1979
(Mean temperature 0.1°C)
Average January rainfall (30
years 1971/2000) 51.2 mm
Wettest January 1995
(Rainfall 108.2 mm); driest January 1987
(Rainfall 9.6 mm)
Wettest Day 9th January 1992 (Rainfall 25.1
mm);
Highest number of "rain
days" (0.2 mm or more) 25
(1988);
lowest number of "rain days" 9
(1992)
Highest number of days with
thunder 1 (1974, 1984.
1988, 1994 and 1998)
Highest number of air frosts 20
(1979, 1985)
Highest number of ground frosts
25 (1979)
Highest number of days with
snow falling 15 (1985)
Highest number of days with snow lying (ground
with more than 50% snow cover @ 0900 GMT) 17 (1985)
 |
 |
 |
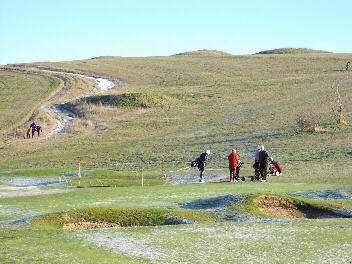
| Golfers are
enjoying the first round of the year in this view on
Therfield Heath, Royston photographed at 1234 GMT on 1st
January 2002. The New Year commenced with a day of
unbroken sunshine (which, in fact, continued for the
first 4 days of January) which registered a total of 6.6
hours for the day. Despite the brilliant sunshine and a
temperature of 3.1°C patches of frost are still in
evidence after an overnight minimum temperature of -3.2°C. |
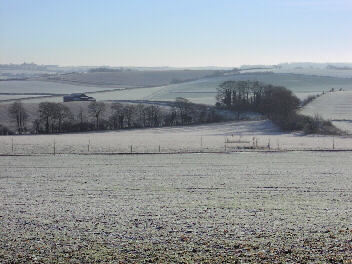
This eastwards
looking view (towards Barley) from Eagle Tavern, Royston
depicts a frostbound landscape at 1017 GMT on 2nd January
2002. A light breeze from the ESE of mean speed 2 knots,
gusting to 12 knots, is drifting across the landscape in
the early morning sunshine (total for the day 6.6 hours).
The temperature is -1.3°C, rising from an overnight
minimum of -3.4°C, and later achieving a maximum of 2.2°C. |
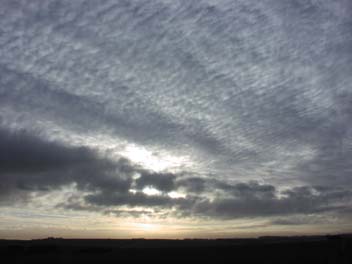
On the morning of
16th January 2002 a fine display of wave type clouds
followed the sunrise, this photograph being taken to the
east of Royston at 0922 GMT. The wind is of mean speed 6
knots, gusting to 12 knots, and its direction is from the
SSW. The temperature has risen from its overnight minimum
of 2.0°C to 2.7°C and continued a gradual rise
throughout the day and evening to 7.9°C by midnight.
Sunshine for the day was 1.7 hours. |
Return to Welcome
to Royston (Iceni) Weather Station page
(This page last updated 10th
February 2002 2338 GMT)