Royston (Iceni) Weather Station
Daily Weather Observations - March 2002
| Date | Max | Min | Grass | Earth | Sunshine | Rainfall | Wind | Mean | Max | Cloud | Mean | Mean | Mean | Fog | Fog | Snow | Snow | Hail | Thunder | Date |
| Temp | Temp | Min | (30cm) | (Hrs) | (MM) | Direc- | Wind | Gust | Cover | MSL | Rel. | Temp | (vis.< | (vis.< | or | Lying | 00/00h | 00/00h | ||
| (°C) | (°C) | Temp | Temp | 00/00h | 09/09h | tion | Speed | Speed | (Oktas) | Pressure | Humd | (°C) | 1000m) | 200m | Rain/ | (>50% | ||||
| 09/09h | 09/09h | (°C) | (°C) | 09h | (mph) | (mph) | 09h | (mb) | (%) | 00/00h | 09h | 09h | Snow | cover | ||||||
| 09/09h | 09h | 00/00h | 00/00h | 00/00h | 00/00h | 00/00h | 09h) | |||||||||||||
| 1 | 9.8 | 1.0 | -3.0 | 5.6 | 5.76 | 0.0 | NE | 3.2 | 25 | 7 | 1012.4 | 82.0 | 2.8 | 0 | 0 | 0 | 0 | 0 | 0 | 1 |
| 2 | 8.5 | -2.8 | -7.3 | 5.2 | 6.42 | 0.0 | NW | 2.6 | 21 | 0 | 1018.9 | 86.5 | 2.5 | 0 | 0 | 0 | 0 | 0 | 0 | 2 |
| 3 | 10.0 | 3.4 | -0.9 | 5.2 | 1.54 | 0.0 | W | 3.5 | 18 | 8 | 1020.6 | 86.8 | 6.0 | 0 | 0 | 0 | 0 | 0 | 0 | 3 |
| 4 | 10.9 | 6.0 | 3.7 | 5.9 | 3.23 | 0.0 | SW | 3.9 | 18 | 7 | 1019.7 | 76.8 | 7.1 | 0 | 0 | 0 | 0 | 0 | 0 | 4 |
| 5 | 11.5 | 4.6 | 1.9 | 6.5 | 4.80 | TR | W | 4.2 | 21 | 8 | 1014.5 | 76.3 | 6.8 | 0 | 0 | 0 | 0 | 0 | 0 | 5 |
| 6 | 11.8 | 5.5 | 2.9 | 6.7 | 0.00 | 0.0 | SW | 11.9 | 39 | 8 | 1006.7 | 83.5 | 9.1 | 0 | 0 | 0 | 0 | 0 | 0 | 6 |
| 7 | 14.0 | 10.2 | 7.9 | 7.4 | 6.96 | 0.0 | W | 7.5 | 39 | 3 | 1017.7 | 66.0 | 10.0 | 0 | 0 | 0 | 0 | 0 | 0 | 7 |
| 8 | 13.5 | 5.6 | 0.6 | 7.5 | 0.57 | 0.7 | SW | 8.0 | 32 | 8 | 1021.8 | 77.7 | 9.6 | 0 | 0 | 0 | 0 | 0 | 0 | 8 |
| 9 | 11.4 | 2.5 | -0.4 | 7.8 | 6.92 | 0.0 | SW | 10.9 | 62 | 1 | 1011.9 | 75.1 | 5.7 | 0 | 0 | 0 | 0 | 0 | 0 | 9 |
| 10 | 11.9 | 1.0 | -1.1 | 7.0 | 1.35 | 3.7 | S | 11.7 | 62 | 7 | 1010.7 | 84.8 | 6.5 | 0 | 0 | 0 | 0 | 0 | 0 | 10 |
| 11 | 12.9 | 6.4 | 4.1 | 7.1 | 1.20 | TR | SW | 6.3 | 28 | 7 | 1011.0 | 85.0 | 8.4 | 0 | 0 | 0 | 0 | 0 | 0 | 11 |
| 12 | 10.9 | 3.5 | -1.5 | 7.5 | 1.36 | 2.7 | CALM | 1.0 | 16 | 8 | 1015.7 | 89.2 | 6.8 | 0 | 0 | 0 | 0 | 0 | 0 | 12 |
| 13 | 7.2 | 4.4 | 3.7 | 7.7 | 1.51 | 0.0 | NE | 4.6 | 25 | 8 | 1019.3 | 83.6 | 4.5 | 0 | 0 | 0 | 0 | 0 | 0 | 13 |
| 14 | 8.0 | 0.5 | -2.0 | 7.0 | 1.78 | 2.0 | E | 5.9 | 37 | 8 | 1012.8 | 80.4 | 3.8 | 0 | 0 | 0 | 0 | 0 | 0 | 14 |
| 15 | 9.8 | 3.5 | 3.4 | 6.9 | 0.00 | 3.3 | E | 2.5 | 28 | 8 | 1008.0 | 98.0 | 5.4 | 0 | 0 | 0 | 0 | 0 | 0 | 15 |
| 16 | 14.5 | 4.9 | 0.9 | 6.9 | 5.38 | 6.1 | S | 3.4 | 28 | 1 | 1010.2 | 90.8 | 9.2 | 0 | 0 | 0 | 0 | 0 | 0 | 16 |
| 17 | 14.1 | 7.1 | 5.4 | 8.0 | 2.57 | 1.8 | S | 3.7 | 25 | 8 | 1005.6 | 90.5 | 9.5 | 0 | 0 | 0 | 0 | 0 | 0 | 17 |
| 18 | 11.1 | 7.4 | 5.0 | 8.5 | 0.71 | 10.1 | SE | 8.9 | 51 | 8 | 994.2 | 93.4 | 8.1 | 0 | 0 | 0 | 0 | 0 | 0 | 18 |
| 19 | 11.8 | 6.1 | 3.1 | 8.4 | 3.59 | 1.2 | W | 6.8 | 25 | 3 | 1003.0 | 86.1 | 8.6 | 0 | 0 | 0 | 0 | 0 | 0 | 19 |
| 20 | 14.0 | 8.8 | 6.9 | 8.9 | 0.30 | 3.9 | W | 6.9 | 28 | 8 | 1011.6 | 87.8 | 10.9 | 0 | 0 | 0 | 0 | 0 | 0 | 20 |
| 21 | 15.5 | 9.5 | 7.8 | 9.5 | 3.83 | 0.0 | SW | 7.0 | 25 | 8 | 1018.7 | 81.6 | 11.2 | 0 | 0 | 0 | 0 | 0 | 0 | 21 |
| 22 | 14.3 | 8.2 | 6.6 | 9.5 | 0.62 | 0.0 | W | 4.5 | 23 | 8 | 1026.6 | 85.5 | 10.3 | 0 | 0 | 0 | 0 | 0 | 0 | 22 |
| 23 | 11.5 | 2.9 | 0.1 | 9.8 | 8.47 | 0.0 | E | 1.3 | 14 | 6 | 1034.3 | 76.3 | 6.6 | 0 | 0 | 0 | 0 | 0 | 0 | 23 |
| 24 | 11.9 | 0.5 | -2.2 | 9.2 | 7.24 | 0.0 | S | 2.8 | 21 | 7 | 1035.2 | 75.7 | 6.0 | 0 | 0 | 0 | 0 | 0 | 0 | 24 |
| 25 | 13.5 | 3.5 | 2.3 | 9.0 | 4.19 | TR | S | 2.6 | 14 | 4 | 1030.7 | 74.3 | 8.4 | 0 | 0 | 0 | 0 | 0 | 0 | 25 |
| 26 | 12.0 | 3.1 | 0.1 | 9.5 | 4.98 | 0.0 | N | 2.6 | 18 | 8 | 1032.8 | 80.2 | 6.9 | 0 | 0 | 0 | 0 | 0 | 0 | 26 |
| 27 | 12.4 | 0.3 | -2.9 | 9.0 | 11.37 | 0.0 | NE | 0.9 | 14 | 1 | 1033.8 | 81.6 | 5.5 | 0 | 0 | 0 | 0 | 0 | 0 | 27 |
| 28 | 13.5 | 0.5 | -2.6 | 8.7 | 12.07 | 0.0 | NE | 1.0 | 18 | 0 | 1028.5 | 74.2 | 6.0 | 0 | 0 | 0 | 0 | 0 | 0 | 28 |
| 29 | 16.0 | 0.1 | -3.4 | 8.5 | 11.78 | 0.0 | N | 2.1 | 18 | 0 | 1022.4 | 72.8 | 7.7 | 0 | 0 | 0 | 0 | 0 | 0 | 29 |
| 30 | 16.7 | 5.4 | 0.6 | 8.9 | 7.85 | TR | S | 3.8 | 21 | 1 | 1020.5 | 61.3 | 10.8 | 0 | 0 | 0 | 0 | 0 | 0 | 30 |
| 31 | 13.0 | 7.0 | 5.6 | 9.3 | 0.96 | TR | SW | 6.4 | 28 | 8 | 1016.0 | 85.4 | 9.6 | 0 | 0 | 0 | 0 | 0 | 0 | 31 |
| Mean/Total | 12.2 | 4.2 | 1.5 | 7.8 | 129.31 | 35.5 | X | 4.9 | X | 5.6 | 1017.6 | 81.6 | 7.4 | 0 | 0 | 0 | 0 | 0 | 0 | Mean/Total |
| (+2.3) | (+1.1) | (120%) | (84%) |
(*All times GMT*)
Additional Data:
Rainfall Duration 53.3 hours.
Air Frost Duration 11.4 hours.
Differences from average:
Differences from average shown in red. Reference periods used are as follows: Temperature 25 Years 1973/1997; rainfall 30 Years 1971/2000; sunshine 30 Years 1961/1990.
Observations practice:
Note: In line with standard meteorological practice the 24 hour maximum temperature and rainfall are read at 0900 GMT and credited to the previous day i.e. data shown above for 1st actually read at 0900 GMT on 2nd and represents the previous 24 hours. The 24 hour minimum and grass minimum temperatures are similarly observed at 0900 GMT but are credited to the day of the reading (e.g. observations made at 0900 GMT on 2nd shown against 2nd and represent previous 24 hours). This is the reason why at daily update of the above table the minimum and grass minimum temperatures appear to be "ahead" of the other data mentioned. (This explanation given in response to a query received).
Graphs and Charts:
Click on the following links to view this month's graphs & charts.........
1. Daily Maximum, Minimum & Grass Minimum Temperatures
2. Daily Maximum & Minimum Temperatures (with 25 Year Comparative Means)
3. Daily Earth (30 cms Depth) Temperature @ 0900 GMT 4. Daily Rainfall 5. Daily Sunshine
6. Daily Maximum Gust & Mean Wind Speed 7. Daily Wind Direction @ 0900 GMT
8. Daily Mean MSL Air Pressure 9. Daily Mean Relative Humidity 10. Thermograph
11 . Barograph 12. Hygrograph 13. Anemograph 14. Wind Direction
15. Sunshine Duration 16. Rainfall Intensity & Duration
March 2002 Weather Review:
.......... and for a text report of the March 2002 weather in Royston click on the link below
March (since 1973) at Royston (Iceni) Weather Station:
Mean day maximum temperature (25 years 1973/1997) 9.9°C
Mean night minimum temperature (25 years 1973/1997) 3.1°C
Highest temperature 21.6°C (17th March 1990); lowest temperature -6.6°C (3rd March 1986)
Lowest grass minimum temperature -13.7°C (3rd March 1986)
Warmest March 1997 (Mean temperature 9.1°C); coldest March 1987 (Mean temperature 4.3°C)
Average March rainfall (30 years 1971/2000) 42.5 mm
Wettest March 1979 (Rainfall 97.8 mm); driest March 1997 (Rainfall 8.1 mm)
Wettest Day 2nd March 1995 (Rainfall 30.1 mm);
Highest number of "rain days" (0.2 mm or more) 25 (1981); lowest number of "rain days" 5 (1990)
Highest number of days with thunder 2 (1986, 1995)
Highest number of air frosts 15 (1987)
Highest number of ground frosts 21 (1987)
Highest number of days with snow falling 11 (1979)
Highest number of days with snow lying (ground with more than 50% snow cover @ 0900 GMT) 4 (1986)
|
|
|
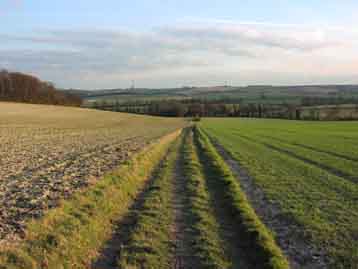
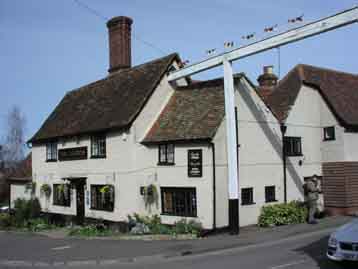
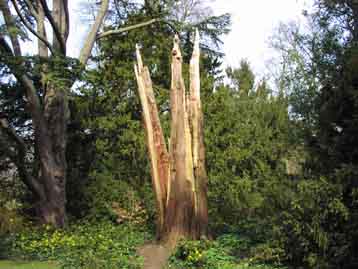
| Evening sunshine is illuminating the landscape in this view looking southwards from a point close to Flint Hall near to the southern boundary of Royston at 1655 GMT on 5th March 2002. Beyond the line of trees (Lovers Walk) in the middle distance is open chalk upland rising to the crest of the East Anglian Heights on the horizon. The temperature at this time is 8.5°C, having reached a maximum for the day of 11.5°C at 1410 GMT. The wind direction is WSW and mean wind speed 4 knots, gusting to 10 knots. Total sunshine for the day was 4.8 hours. | The Fox and Hounds P.H. is a familiar landmark in the village of Barley, about 5 km SE of Royston and is seen here at 1354 GMT on 23rd March 2002. Although conditions appear to be clear and bright in the photograph the sun is actually shining through a milky haze which covers much of the sky, the only area of clear sky being towards the eastern horizon. On this very pleasant Spring day the temperature at this time is 10.5°C (day maximum 11.5°C), whilst the daily total of sunshine recorded was 8.5 hours. | The spectacular power of a lightning strike is well illustrated by the remains of this Giant Redwood (Sequoiadendron Giganteum) tree at Anglesey Abbey, some 28 km NE of Royston (as pictured at 1333 GMT on 27th March 2002). The damage was done by an isolated strike on 5th July 1999, after lightning 15 years earlier removed the top 7 metres of the tree. Bright sunshine prevailed for most of the day of the picture and had totalled 11.4 hours at Royston by sunset. The day's maximum temperature at Royston was 12.4°C. |
Return to Welcome to Royston (Iceni) Weather Station page
(This page last updated 10th April 2002 1931 GMT)