Royston (Iceni) Weather Station
Daily Weather Observations - April 2002
| Date | Max | Min | Grass | Earth | Sunshine | Rainfall | Wind | Mean | Max | Cloud | Mean | Mean | Mean | Fog | Fog | Snow | Snow | Hail | Thunder | Date |
| Temp | Temp | Min | (30cm) | (Hrs) | (MM) | Direc- | Wind | Gust | Cover | MSL | Rel. | Temp | (vis.< | (vis.< | or | Lying | 00/00h | 00/00h | ||
| (°C) | (°C) | Temp | Temp | 00/00h | 09/09h | tion | Speed | Speed | (Oktas) | Pressure | Humd | (°C) | 1000m) | 200m | Rain/ | (>50% | ||||
| 09/09h | 09/09h | (°C) | (°C) | 09h | (mph) | (mph) | 09h | (mb) | (%) | 00/00h | 09h | 09h | Snow | cover | ||||||
| 09/09h | 09h | 00/00h | 00/00h | 00/00h | 00/00h | 00/00h | 09h) | |||||||||||||
| 1 | 16.2 | 9.1 | 8.5 | 9.6 | 1.9 | 0.0 | S | 5.7 | 28 | 7 | 1014.2 | 77.7 | 11.3 | 0 | 0 | 0 | 0 | 0 | 0 | 1 |
| 2 | 15.4 | 6.1 | 4.6 | 10.0 | 0.9 | TR | SE | 3.9 | 25 | 8 | 1011.5 | 77.2 | 11.4 | 0 | 0 | 0 | 0 | 0 | 0 | 2 |
| 3 | 19.4 | 9.5 | 8.0 | 10.5 | 11.3 | 0.0 | SE | 3.1 | 21 | 1 | 1007.6 | 66.8 | 13.4 | 0 | 0 | 0 | 0 | 0 | 0 | 3 |
| 4 | 19.6 | 3.5 | 0.1 | 10.6 | 9.9 | 0.0 | N | 1.0 | 14 | 0 | 1009.4 | 75.5 | 10.4 | 0 | 0 | 0 | 0 | 0 | 0 | 4 |
| 5 | 16.5 | 2.9 | -0.2 | 10.7 | 10.2 | 0.0 | NE | 2.0 | 21 | 1 | 1009.4 | 77.0 | 8.0 | 0 | 0 | 0 | 0 | 0 | 0 | 5 |
| 6 | 11.8 | 3.6 | 0.5 | 10.4 | 12.7 | 0.0 | NE | 4.8 | 30 | 0 | 1019.9 | 66.4 | 6.2 | 0 | 0 | 0 | 0 | 0 | 0 | 6 |
| 7 | 13.0 | -0.1 | -3.4 | 9.6 | 12.7 | 0.0 | NE | 3.7 | 23 | 1 | 1024.7 | 78.8 | 5.5 | 0 | 0 | 0 | 0 | 0 | 0 | 7 |
| 8 | 14.0 | 3.6 | 0.2 | 9.8 | 7.7 | 0.0 | NE | 1.4 | 16 | 1 | 1025.5 | 72.6 | 7.5 | 0 | 0 | 0 | 0 | 0 | 0 | 8 |
| 9 | 10.3 | 1.0 | -2.5 | 9.9 | 4.5 | TR | NE | 3.1 | 25 | 7 | 1026.1 | 82.4 | 5.4 | 0 | 0 | 0 | 0 | 0 | 0 | 9 |
| 10 | 13.1 | 2.1 | -0.2 | 9.4 | 11.4 | 0.0 | NE | 4.6 | 28 | 0 | 1022.2 | 70.8 | 6.8 | 0 | 0 | 0 | 0 | 0 | 0 | 10 |
| 11 | 12.5 | 1.5 | -1.1 | 9.3 | 3.8 | 0.0 | NE | 2.2 | 23 | 0 | 1013.4 | 73.7 | 6.1 | 0 | 0 | 0 | 0 | 0 | 0 | 11 |
| 12 | 14.1 | 1.5 | -1.7 | 9.2 | 10.6 | TR | N | 3.8 | 28 | 1 | 1010.9 | 75.8 | 7.0 | 0 | 0 | 0 | 0 | 0 | 0 | 12 |
| 13 | 11.5 | 2.0 | 0.4 | 9.5 | 2.4 | TR | N | 2.8 | 25 | 7 | 1012.9 | 77.1 | 5.4 | 0 | 0 | 0 | 0 | 0 | 0 | 13 |
| 14 | 12.0 | 0.3 | -2.6 | 9.1 | 5.5 | TR | W | 1.7 | 14 | 3 | 1014.2 | 67.4 | 6.4 | 0 | 0 | 0 | 0 | 0 | 0 | 14 |
| 15 | 10.7 | 4.5 | 1.0 | 9.4 | 0.1 | 2.6 | NW | 0.7 | 12 | 8 | 1017.9 | 87.3 | 7.1 | 0 | 0 | 0 | 0 | 0 | 0 | 15 |
| 16 | 15.9 |
2.1 |
-1.4 | 9.0 | 11.9 | 0.0 | NW | 0.8 | 12 |
0 |
1018.3 | 61.5 | 8.8 | 0 | 0 | 0 | 0 | 0 | 0 | 16 |
| 17 | 15.9 | 3.1 | -0.6 | 9.8 | 6.8 | 0.3 | W | 1.5 | 18 |
1 |
1015.6 | 66.1 | 9.5 | 0 | 0 | 0 | 0 | 0 | 0 | 17 |
| 18 | 14.7 | 3.9 | 2.4 | 10.4 | 8.3 | 1.7 | SW | 5.6 | 32 |
2 |
1016.7 | 77.0 | 8.3 | 0 | 0 | 0 | 0 | 1 | 0 | 18 |
| 19 | 12.4 | 6.0 | 4.6 | 10.5 | 1.5 | 0.0 | W | 1.6 | 12 | 7 | 1023.2 | 82.6 | 8.0 | 0 | 0 | 0 | 0 | 0 | 0 | 19 |
| 20 | 17.5 | 3.4 | -0.4 | 10.1 | 9.6 | 0.0 | S | 2.6 | 14 | 1 | 1031.3 | 72.0 | 10.5 | 0 | 0 | 0 | 0 | 0 | 0 | 20 |
| 21 | 20.5 | 6.6 | 5.0 | 11.0 | 11.1 | 0.0 | S | 5.5 | 23 | 6 | 1034.4 | 67.4 | 13.2 | 0 | 0 | 0 | 0 | 0 | 0 | 21 |
| 22 | 20.0 | 8.5 | 7.0 | 11.8 | 6.0 | 0.0 | SW | 8.1 | 30 | 3 | 1031.3 | 68.6 | 13.6 | 0 | 0 | 0 | 0 | 0 | 0 | 22 |
| 23 | 22.7 | 8.5 | 6.4 | 12.4 | 13.4 | 0.0 | W | 4.4 | 18 | 2 | 1032.0 | 75.5 | 15.3 | 0 | 0 | 0 | 0 | 0 | 0 | 23 |
| 24 | 21.8 | 9.0 | 6.8 | 13.4 | 7.4 | 0.0 | NW | 2.7 | 14 | 8 | 1027.4 | 74.0 | 14.3 | 1 | 0 | 0 | 0 | 0 | 0 | 24 |
| 25 | 17.7 | 8.4 | 6.0 | 13.5 | 8.9 | 1.2 | NW | 3.5 | 21 | 5 | 1022.6 | 65.9 | 12.7 | 0 | 0 | 0 | 0 | 0 | 0 | 25 |
| 26 | 15.1 | 7.0 | 6.3 | 13.4 | 3.9 | 2.2 | S | 9.0 | 46 | 8 | 1006.6 | 75.9 | 8.9 | 0 | 0 | 0 | 0 | 0 | 0 | 26 |
| 27 | 12.6 | 5.3 | 3.1 | 12.6 | 4.7 | 8.6 | W | 7.8 | 32 | 4 | 1008.8 | 77.0 | 8.3 | 0 | 0 | 0 | 0 | 0 | 0 | 27 |
| 28 | 14.7 | 7.5 | 6.2 | 12.0 | 2.7 | 3.1 | SW | 11.6 | 53 | 7 | 994.1 | 79.4 | 9.4 | 0 | 0 | 0 | 0 | 0 | 0 | 28 |
| 29 | 14.1 | 4.5 | 2.1 | 11.7 | 6.6 | 5.9 | W | 12.1 | 51 | 7 | 999.8 | 76.2 | 8.0 | 0 | 0 | 0 | 0 | 1 | 0 | 29 |
| 30 | 11.7 | 6.6 | 5.0 | 11.3 | 0.3 | 10.3 | SW | 9.1 | 44 | 8 | 998.2 | 94.6 | 8.4 | 0 | 0 | 0 | 0 | 0 | 0 | 30 |
| Mean/Total | 15.2 | 4.7 | 2.3 | 10.7 | 208.2 | 35.9 | X | 4.3 | X | 3.8 | 1016.7 | 74.7 | 9.2 | 1 | 0 | 0 | 0 | 2 | 0 | Mean/Total |
| (+2.4) | (+0.6) | (147%) | (81%) |
(*All times GMT*)
Additional Data:
Rainfall Duration 34.7 hours
Air Frost Duration 1.0 hours
Differences from average:
Differences from average shown in red. Reference periods used are as follows: Temperature 25 Years 1973/1997; rainfall 30 Years 1971/2000; sunshine 30 Years 1961/1990.
Observations practice:
Note: In line with standard meteorological practice the 24 hour maximum temperature and rainfall are read at 0900 GMT and credited to the previous day i.e. data shown above for 1st actually read at 0900 GMT on 2nd and represents the previous 24 hours. The 24 hour minimum and grass minimum temperatures are similarly observed at 0900 GMT but are credited to the day of the reading (e.g. observations made at 0900 GMT on 2nd shown against 2nd and represent previous 24 hours). This is the reason why at daily update of the above table the minimum and grass minimum temperatures appear to be "ahead" of the other data mentioned. (This explanation given in response to a query received).
Graphs and Charts:
Click on the following links to view this month's graphs & charts.........
1. Daily Maximum, Minimum & Grass Minimum Temperatures
2. Daily Maximum & Minimum Temperatures (with 25 Year Comparative Means)
3. Daily Earth (30 cms Depth) Temperature @ 0900 GMT 4. Daily Rainfall 5. Daily Sunshine
6. Daily Maximum Gust & Mean Wind Speed 7. Daily Wind Direction @ 0900 GMT
8. Daily Mean MSL Air Pressure 9. Daily Mean Relative Humidity 10. Thermograph
11 . Barograph 12. Hygrograph 13. Anemograph 14. Wind Direction
15. Sunshine Duration 16. Rainfall Intensity & Duration
April 2002 Weather Review:
.......... and for a text report of the March 2002 weather in Royston click on the link below
April (since 1973) at Royston (Iceni) Weather Station:
Mean daily maximum temperature (25 years 1973/1997) 12.8°C
Mean daily minimum temperature (25 years 1973/1997) 4.1°C
Highest temperature 23.3°C (20th April 1996); lowest temperature -4.1°C (11th April 1978)
Lowest grass minimum temperature -9.4°C (4th April 1996)
Warmest April 1987 (Mean temperature 11.2°C); coldest April 1978 (Mean temperature 6.2°C)
Average April rainfall (30 years 1971/2000) 44.3 mm
Wettest April 1998 (Rainfall 120.7 mm); driest April 1984 (Rainfall 9.0 mm)
Wettest Day 9th April 1998 (Rainfall 32.0 mm);
Highest number of "rain days" (0.2 mm or more) 26 (1998); lowest number of "rain days" 5 (1976)
Highest number of days with thunder 7 (1998)
Highest number of air frosts 8 (1975)
Highest number of ground frosts 15 (1974, 1984)
Highest number of days with snow falling 5 (1975, 1986)
Highest number of days with snow lying (ground with more than 50% snow cover @ 0900 GMT) 2 (1978, 1983)
|
|
|
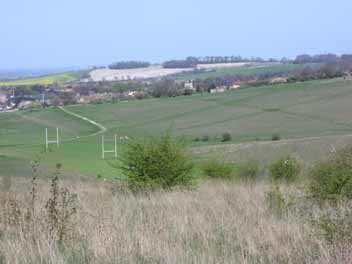
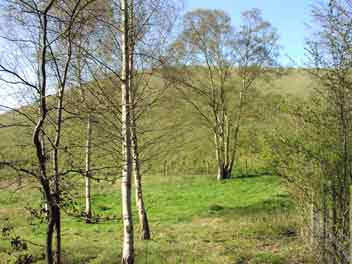
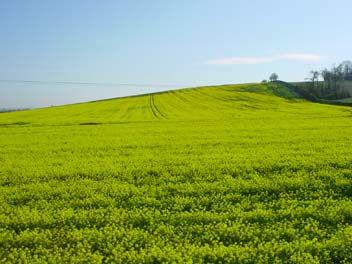
| This view in a north-easterly direction across the eastern end of Therfield Heath also takes in the town of Royston in the middle distance with Hyde Hill rising to the NE of the town in the far distance. The chalk soil on Hyde Hill is showing up as a particularly light colour after over two weeks without any measurable rainfall (the drought lasted, in fact, a total of 25 days from 21st March to 14th April). This photograph was taken at 1452 GMT on 6th April 2002 (see next picture for current weather conditions). | A dry valley intersecting the Pen Hills at the western end of Therfield Heath, Royston is the vantage point for this picture as seen at 1523 GMT on 6th April 2002. Brilliant sunshine lasted all day yielding a total of 12.7 hours. Although the temperature is 9.7°C it feels rather cold in exposed locations due to a blustery ENE wind of mean speed 7 knots, gusting to 18 knots. A maximum temperature of 11.8°C was achieved during the day after an overnight minimum of 3.6°C. | A feature of the month of April in the Royston area is the bright yellow expanses of oilseed rape, this scene to the north-east of the town at the point where Hyde Hill rolls down to the South Cambridgeshire plain being one such example. In bright sunshine at 0810 GMT on 18th April 2002 this was the view from the A505 Royston by-pass looking northwards. The temperature is 9.3°C, and the wind is south-westerly, mean speed 5 knots, gusting to 16 knots. Sunshine for the day was 8.3 hours. |
Return to Welcome to Royston (Iceni) Weather Station page
(This page last updated 9th May 2002 1930 GMT)