Royston (Iceni) Weather Station
Daily Weather Observations - May 2002
| Date | Max | Min | Grass | Earth | Sunshine | Rainfall | Wind | Mean | Max | Cloud | Mean | Mean | Mean | Fog | Fog | Snow | Snow | Hail | Thunder | Date |
| Temp | Temp | Min | (30cm) | (Hrs) | (MM) | Direc- | Wind | Gust | Cover | MSL | Rel. | Temp | (vis.< | (vis.< | or | Lying | 00/00h | 00/00h | ||
| (°C) | (°C) | Temp | Temp | 00/00h | 09/09h | tion | Speed | Speed | (Oktas) | Pressure | Humd | (°C) | 1000m) | 200m | Rain/ | (>50% | ||||
| 09/09h | 09/09h | (°C) | (°C) | 09h | (mph) | (mph) | 09h | (mb) | (%) | 00/00h | 09h | 09h | Snow | cover | ||||||
| 09/09h | 09h | 00/00h | 00/00h | 00/00h | 00/00h | 00/00h | 09h) | |||||||||||||
| 1 | 15.0 | 5.8 | 4.1 | 11.0 | 9.8 | 0.4 | W | 7.4 | 28 | 3 | 1001.8 | 71.7 | 9.7 | 0 | 0 | 0 | 0 | 0 | 0 | 1 |
| 2 | 16.3 | 4.0 | 2.1 | 11.5 | 7.7 | 0.0 | NW | 2.1 | 21 | 5 | 1009.6 | 73.3 | 9.4 | 0 | 0 | 0 | 0 | 0 | 0 | 2 |
| 3 | 15.9 | 4.3 | 1.7 | 12.0 | 5.7 | 8.6 | N | 2.0 | 28 | 7 | 1018.8 | 84.6 | 8.0 | 0 | 0 | 0 | 0 | 1 | 1 | 3 |
| 4 | 13.6 | 3.3 | 0.2 | 11.9 | 5.1 | TR | N | 1.8 | 21 | 7 | 1023.7 | 79.3 | 7.5 | 0 | 0 | 0 | 0 | 0 | 0 | 4 |
| 5 | 12.5 | 1.5 | -1.6 | 11.5 | 1.6 | 1.4 | N | 4.4 | 30 | 7 | 1024.9 | 81.4 | 6.6 | 0 | 0 | 0 | 0 | 0 | 0 | 5 |
| 6 | 15.0 | 6.1 | 6.0 | 11.5 | 0.7 | 1.5 | NE | 2.3 | 18 | 8 | 1024.2 | 89.7 | 10.3 | 0 | 0 | 0 | 0 | 0 | 0 | 6 |
| 7 | 16.5 | 8.4 | 8.4 | 12.2 | 1.9 | TR | NE | 1.4 | 16 | 8 | 1022.9 | 90.0 | 10.4 | 0 | 0 | 0 | 0 | 0 | 0 | 7 |
| 8 | 17.1 | 5.3 | 1.7 | 12.1 | 5.3 | 0.0 | NE | 2.9 | 21 | 8 | 1019.9 | 87.6 | 9.6 | 1 | 0 | 0 | 0 | 0 | 0 | 8 |
| 9 | 11.5 | 8.4 | 8.4 | 12.7 | 0.0 | 0.1 | N | 2.4 | 14 | 8 | 1013.0 | 93.7 | 9.6 | 0 | 0 | 0 | 0 | 0 | 0 | 9 |
| 10 | 16.2 | 9.2 | 9.2 | 12.5 | 0.0 | 0.0 | NW | 1.7 | 14 | 8 | 1008.8 | 88.7 | 11.9 | 0 | 0 | 0 | 0 | 0 | 0 | 10 |
| 11 | 15.0 | 9.8 | 9.4 | 13.0 | 0.9 | 0.0 | NW | 1.9 | 16 | 8 | 1011.1 | 83.5 | 11.4 | 0 | 0 | 0 | 0 | 0 | 0 | 11 |
| 12 | 16.6 | 5.5 | 3.1 | 12.6 | 7.7 | 0.5 | SE | 1.9 | 16 | 2 | 1013.7 | 78.0 | 11.1 | 0 | 0 | 0 | 0 | 0 | 0 | 12 |
| 13 | 14.5 | 8.6 | 6.5 | 13.0 | 0.0 | 11.2 | S | 5.0 | 30 | 8 | 1007.8 | 93.7 | 11.1 | 0 | 0 | 0 | 0 | 0 | 0 | 13 |
| 14 | 17.0 | 9.9 | 8.7 | 12.9 | 7.4 | 0.0 | SW | 9.6 | 41 | 4 | 1010.8 | 72.6 | 12.7 | 0 | 0 | 0 | 0 | 0 | 0 | 14 |
| 15 | 20.0 | 9.5 | 7.4 | 13.4 | 11.6 | 0.0 | SW | 6.3 | 28 | 5 | 1022.4 | 74.1 | 14.6 | 0 | 0 | 0 | 0 | 0 | 0 | 15 |
| 16 | 23.5 | 9.0 | 7.1 | 14.3 | 14.3 | 0.0 | SE | 2.8 | 16 | 0 | 1019.7 | 72.4 | 16.3 | 0 | 0 | 0 | 0 | 0 | 0 | 16 |
| 17 | 22.5 | 12.6 | 10.5 | 15.4 | 6.3 | 1.7 | E | 2.4 | 25 | 6 | 1011.8 | 72.2 | 16.1 | 0 | 0 | 0 | 0 | 0 | 0 | 17 |
| 18 | 16.7 | 12.0 | 11.8 | 16.0 | 3.6 | 0.2 | SW | 5.3 | 28 | 8 | 1012.3 | 86.1 | 13.5 | 0 | 0 | 0 | 0 | 0 | 0 | 18 |
| 19 | 21.3 | 10.5 | 8.3 | 15.0 | 8.7 | 0.0 | SW | 5.9 | 25 | 3 | 1015.9 | 74.9 | 15.4 | 0 | 0 | 0 | 0 | 0 | 0 | 19 |
| 20 | 19.2 | 11.8 | 10.1 | 15.9 | 3.3 | 8.6 | S | 4.5 | 25 | 6 | 1009.8 | 76.2 | 15.4 | 0 | 0 | 0 | 0 | 0 | 0 | 20 |
| 21 | 18.7 | 13.0 | 12.0 | 16.0 | 3.4 | 11.0 | S | 4.8 | 25 | 7 | 998.7 | 83.3 | 14.8 | 0 | 0 | 0 | 0 | 0 | 0 | 21 |
| 22 | 18.8 | 12.6 | 11.6 | 15.9 | 8.2 | TR | S | 7.8 | 37 | 3 | 994.4 | 76.6 | 14.3 | 0 | 0 | 0 | 0 | 0 | 0 | 22 |
| 23 | 18.2 | 10.7 | 9.4 | 15.5 | 8.0 | 3.7 | SW | 6.7 | 28 | 4 | 1004.0 | 79.4 | 13.0 | 0 | 0 | 0 | 0 | 0 | 0 | 23 |
| 24 | 17.7 | 9.7 | 8.6 | 15.5 | 5.6 | 0.1 | SW | 9.4 | 46 | 2 | 1001.8 | 78.6 | 12.3 | 0 | 0 | 0 | 0 | 0 | 0 | 24 |
| 25 | 16.6 | 8.3 | 6.7 | 15.3 | 6.9 | 2.3 | SW | 8.9 | 41 | 4 | 1006.2 | 72.6 | 11.7 | 0 | 0 | 0 | 0 | 0 | 0 | 25 |
| 26 | 13.4 | 8.7 | 8.0 | 15.4 | 3.4 | 3.8 | S | 5.8 | 35 | 7 | 999.3 | 88.5 | 9.6 | 0 | 0 | 0 | 0 | 0 | 1 | 26 |
| 27 | 18.4 | 5.6 | 4.2 | 14.6 | 10.8 | 0.0 | S | 3.5 | 25 | 6 | 1003.8 | 74.0 | 12.0 | 0 | 0 | 0 | 0 | 0 | 0 | 27 |
| 28 | 14.9 | 8.0 | 6.6 | 15.4 | 1.3 | 0.7 | S | 5.4 | 32 | 8 | 1004.7 | 84.8 | 11.2 | 0 | 0 | 0 | 0 | 0 | 0 | 28 |
| 29 | 17.0 | 8.6 | 6.9 | 14.9 | 7.0 | 0.3 | SW | 8.1 | 32 | 6 | 1012.3 | 72.5 | 12.2 | 0 | 0 | 0 | 0 | 0 | 0 | 29 |
| 30 | 16.8 | 8.6 | 7.2 | 15.0 | 4.9 | 2.5 | SW | 6.6 | 28 | 7 | 1021.0 | 78.3 | 12.3 | 0 | 0 | 0 | 0 | 0 | 0 | 30 |
| 31 | 19.8 | 8.5 | 6.4 | 15.2 | 12.5 | 0.0 | W | 3.8 | 21 | 2 | 1025.8 | 64.2 | 14.1 | 0 | 0 | 0 | 0 | 0 | 0 | 31 |
| Mean/Total | 17.0 | 8.3 | 6.8 | 13.8 | 173.3 | 60.6 | X | 4.7 | X | 5.6 | 1012.1 | 79.9 | 11.9 | 1 | 0 | 0 | 0 | 1 | 2 | Mean/Total |
| (+0.5) | (+1.3) | (90%) | (129%) |
(*All times GMT*)
Additional Data:
Rainfall Duration 53.6 hours
Air Frost Duration NIL hours
Differences from average:
Differences from average shown in red. Reference periods used are as follows: Temperature 25 Years 1973/1997; rainfall 30 Years 1971/2000; sunshine 30 Years 1961/1990.
Observations practice:
Note: In line with standard meteorological practice the 24 hour maximum temperature and rainfall are read at 0900 GMT and credited to the previous day i.e. data shown above for 1st actually read at 0900 GMT on 2nd and represents the previous 24 hours. The 24 hour minimum and grass minimum temperatures are similarly observed at 0900 GMT but are credited to the day of the reading (e.g. observations made at 0900 GMT on 2nd shown against 2nd and represent previous 24 hours). This is the reason why at daily update of the above table the minimum and grass minimum temperatures appear to be "ahead" of the other data mentioned. (This explanation given in response to a query received).
Graphs and Charts:
Click on the following links to view this month's graphs and charts.......
1. Daily Maximum, Minimum & Grass Minimum Temperatures
2. Daily Maximum & Minimum Temperatures (with 25 Year Comparative Means)
3. Daily Earth (30 cms Depth) Temperature @ 0900 GMT 4. Daily Rainfall 5. Daily Sunshine
6. Daily Maximum Gust & Mean Wind Speed 7. Daily Wind Direction @ 0900 GMT
8. Daily Mean MSL Air Pressure 9. Daily Mean Relative Humidity 10. Thermograph
11 . Barograph 12. Hygrograph 13. Anemograph 14. Wind Direction
15. Sunshine Duration 16. Rainfall Intensity & Duration
May 2002 Weather Review:
Click on the link below for a text report of the May 2002 weather in Royston
May (since 1972) at Royston (Iceni) Weather Station:
Mean daily maximum temperature (25 years 1973/1997) 16.5°C
Mean daily minimum temperature (25 years 1973/1997) 7.0°C
Highest temperature 28.4°C (24th May 1989); lowest temperature -1.0°C (16th May1996)
Lowest grass minimum temperature -5.2°C (16th May 1996)
Warmest May 1992 (Mean temperature 14.5°C); coldest May 1984, 1996 (Mean temperature 9.7°C)
Average May rainfall (30 years 1971/2000) 47.0 mm
Wettest May 1983 (Rainfall 125.2 mm); driest May 1990 (Rainfall 3.7 mm)
Wettest Day 5th May 1978 (Rainfall 52.5 mm);
Highest number of "rain days" (0.2 mm or more) 22 (1983); lowest number of "rain days" 3 (1990)
Highest number of days with thunder 8 (1983)
Highest number of air frosts 4 (1996)
Highest number of ground frosts 14 (1996)
Highest number of days with snow falling 2 (1997)
Highest number of days with snow lying (ground with more than 50% snow cover @ 0900 GMT) 0
|
|
|
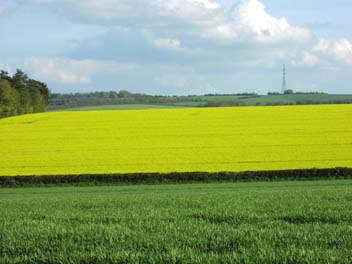
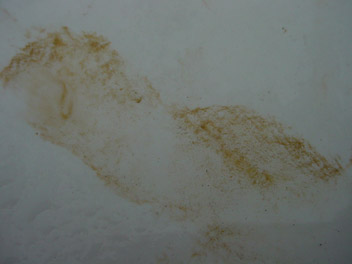
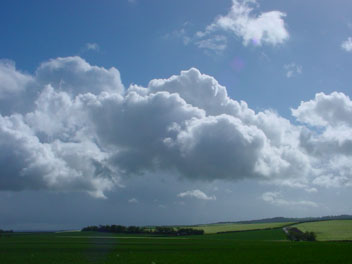
| This is a view looking southwards from a point just a few metres west of the Greenwich Meridian (0° Longitude) on the Burloes Estate, Royston to the crest of the East Anglian Heights on the horizon, where the familiar landmark of the communications mast of RAF Barkway is visble. Much of the intervening landscape is hidden from view beyond the field of oilseed rape which is being illuminated by the bright late afternoon sunshine (photograph taken at 1647 GMT on 4th May 2002). The temperature is 11.8°C (day maximum 13.6°C) with a NNE wind of mean speed 5 knots gusting to 16 knots. Sunshine for the day was 5.1 hours. | The picture above is a close-up of part of the roof of the Stevenson Screen at Royston (Iceni) Weather Station as seen at the time of the morning observation on 18th May 2002, and shows a deposit of orange-brown dust/mud which has been washed out in the overnight rain. The remainder of the screen roof is similarly covered in such deposits. The origin of this dust is most probably the deserts of North Africa, the weather conditions for the northward transport of dust blown up from this region having been favourable in the previous few days. The observation has also been facilitated by the dust falling in only light rain (1.7 millimetres recorded). | Shower cloud started to build up early on 26th May 2002 and this picture taken at 0822 GMT shows a shower passing to the east of Royston over North Essex into Cambridgeshire. The B1039 road between Royston and Barley can just be made out between the two fields of barley which are being highlighted by the bright sunshine. The temperature is 11.8°C after an overnight minimum of 8.7°C. It later rose to a maximum of 13.4°C, indicating a cool day, being 5°C below the long term average for this day. Frequent showers occurred during the day yielding a total of 3.8 millimetres rainfall at Royston. Sunshine between the showers totalled 3.4 hours for the day. |
Return to Welcome to Royston (Iceni) Weather Station page
(This page last updated 12th June 2002 1956 GMT)