Royston (Iceni) Weather Station
Daily Weather Observations - June 2002
| Date | Max | Min | Grass | Earth | Sunshine | Rainfall | Wind | Mean | Max | Cloud | Mean | Mean | Mean | Fog | Fog | Snow | Snow | Hail | Thunder | Date |
| Temp | Temp | Min | (30cm) | (Hrs) | (MM) | Direc- | Wind | Gust | Cover | MSL | Rel. | Temp | (vis.< | (vis.< | or | Lying | 00/00h | 00/00h | ||
| (°C) | (°C) | Temp | Temp | 00/00h | 09/09h | tion | Speed | Speed | (Oktas) | Pressure | Humd | (°C) | 1000m) | 200m | Rain/ | (>50% | ||||
| 09/09h | 09/09h | (°C) | (°C) | 09h | (mph) | (mph) | 09h | (mb) | (%) | 00/00h | 09h | 09h | Snow | cover | ||||||
| 09/09h | 09h | 00/00h | 00/00h | 00/00h | 00/00h | 00/00h | 09h) | |||||||||||||
| 1 | 20.5 | 11.0 | 6.9 | 15.9 | 15.9 | 0.0 | S | 2.6 | 21 | 1 | 1025.3 | 62.6 | 15.1 | 0 | 0 | 0 | 0 | 0 | 0 | 1 |
| 2 | 24.4 | 10.0 | 7.1 | 16.4 | 10.3 | TR | SE | 3.0 | 23 | 1 | 1016.6 | 71.3 | 17.7 | 0 | 0 | 0 | 0 | 0 | 0 | 2 |
| 3 | 18.5 | 13.8 | 12.9 | 17.3 | 3.5 | TR | SW | 5.2 | 23 | 8 | 1008.2 | 73.7 | 15.2 | 0 | 0 | 0 | 0 | 0 | 0 | 3 |
| 4 | 16.3 | 8.7 | 7.6 | 16.9 | 0.5 | 0.8 | W | 1.5 | 16 | 8 | 1006.1 | 73.8 | 12.3 | 0 | 0 | 0 | 0 | 0 | 0 | 4 |
| 5 | 14.5 | 9.2 | 7.1 | 16.3 | 0.0 | 10.5 | N | 1.6 | 16 | 8 | 998.7 | 98.9 | 11.5 | 0 | 0 | 0 | 0 | 0 | 0 | 5 |
| 6 | 15.1 | 13.5 | 13.5 | 15.5 | 0.0 | 1.8 | N | 1.4 | 12 | 8 | 1000.2 | 97.5 | 14.3 | 0 | 0 | 0 | 0 | 0 | 0 | 6 |
| 7 | 16.1 | 13.6 | 13.6 | 15.5 | 0.0 | TR | SE | 1.9 | 21 | 8 | 1002.4 | 96.3 | 13.4 | 0 | 0 | 0 | 0 | 0 | 0 | 7 |
| 8 | 19.4 | 10.4 | 9.7 | 15.5 | 5.8 | TR | SE | 2.0 | 18 | 2 | 1006.1 | 80.1 | 14.6 | 0 | 0 | 0 | 0 | 0 | 0 | 8 |
| 9 | 15.1 | 10.0 | 7.4 | 15.9 | 2.3 | 2.0 | SW | 4.9 | 25 | 8 | 1005.1 | 87.8 | 12.1 | 0 | 0 | 0 | 0 | 0 | 0 | 9 |
| 10 | 17.6 | 9.5 | 7.7 | 15.2 | 8.1 | 0.7 | SW | 8.3 | 37 | 7 | 1007.3 | 74.0 | 13.0 | 0 | 0 | 0 | 0 | 0 | 0 | 10 |
| 11 | 18.4 | 8.8 | 7.0 | 15.4 | 7.9 | 1.9 | W | 6.0 | 30 | 4 | 1012.3 | 71.7 | 13.3 | 0 | 0 | 0 | 0 | 0 | 0 | 11 |
| 12 | 18.0 | 10.3 | 10.0 | 16.0 | 0.9 | 0.8 | W | 3.7 | 23 | 7 | 1012.6 | 75.7 | 13.5 | 0 | 0 | 0 | 0 | 0 | 0 | 12 |
| 13 | 19.0 | 10.5 | 10.5 | 16.4 | 0.3 | TR | W | 4.1 | 23 | 8 | 1014.2 | 79.7 | 14.1 | 0 | 0 | 0 | 0 | 0 | 0 | 13 |
| 14 | 21.3 | 13.0 | 12.8 | 16.9 | 1.1 | 1.0 | S | 4.8 | 28 | 7 | 1011.8 | 86.4 | 17.9 | 0 | 0 | 0 | 0 | 0 | 0 | 14 |
| 15 | 22.1 | 12.4 | 9.6 | 17.0 | 5.6 | 0.2 | SW | 7.1 | 30 | 6 | 1013.0 | 72.9 | 16.6 | 0 | 0 | 0 | 0 | 0 | 0 | 15 |
| 16 | 23.9 | 14.3 | 13.2 | 17.1 | 1.8 | 0.0 | SW | 6.6 | 30 | 8 | 1014.1 | 82.7 | 17.8 | 0 | 0 | 0 | 0 | 0 | 0 | 16 |
| 17 | 27.7 | 15.5 | 13.2 | 18.0 | 16.1 | 7.2 | SW | 5.9 | 25 | 0 | 1013.2 | 72.8 | 21.4 | 0 | 0 | 0 | 0 | 0 | 0 | 17 |
| 18 | 22.1 | 15.5 | 11.2 | 19.1 | 8.2 | TR | W | 4.5 | 30 | 8 | 1016.5 | 71.4 | 17.8 | 0 | 0 | 0 | 0 | 0 | 1 | 18 |
| 19 | 21.6 | 10.7 | 8.9 | 18.6 | 12.6 | 0.0 | W | 3.0 | 18 | 1 | 1022.6 | 60.6 | 16.5 | 0 | 0 | 0 | 0 | 0 | 0 | 19 |
| 20 | 21.8 | 12.6 | 10.7 | 18.6 | 5.2 | 0.4 | S | 2.7 | 18 | 8 | 1020.5 | 68.7 | 17.0 | 0 | 0 | 0 | 0 | 0 | 0 | 20 |
| 21 | 21.9 | 11.8 | 10.9 | 18.5 | 5.5 | 1.3 | SW | 4.7 | 25 | 6 | 1019.9 | 66.7 | 16.0 | 0 | 0 | 0 | 0 | 0 | 0 | 21 |
| 22 | 19.5 | 12.4 | 11.7 | 18.7 | 2.2 | TR | SW | 6.5 | 25 | 7 | 1018.0 | 75.5 | 15.9 | 0 | 0 | 0 | 0 | 0 | 0 | 22 |
| 23 | 21.0 | 10.4 | 8.1 | 18.0 | 11.7 | 0.0 | W | 4.5 | 21 | 2 | 1021.4 | 63.3 | 15.5 | 0 | 0 | 0 | 0 | 0 | 0 | 23 |
| 24 | 22.5 | 9.5 | 6.6 | 18.0 | 12.3 | 0.0 | W | 3.8 | 18 | 1 | 1026.7 | 59.7 | 16.1 | 0 | 0 | 0 | 0 | 0 | 0 | 24 |
| 25 | 20.9 | 10.4 | 7.5 | 18.3 | 6.9 | 0.0 | W | 2.7 | 16 | 1 | 1027.7 | 65.8 | 16.0 | 0 | 0 | 0 | 0 | 0 | 0 | 25 |
| 26 | 24.5 | 10.1 | 6.6 | 18.0 | 15.3 | 0.0 | SW | 4.4 | 23 | 1 | 1022.1 | 61.4 | 17.6 | 0 | 0 | 0 | 0 | 0 | 0 | 26 |
| 27 | 18.6 | 9.4 | 7.1 | 18.8 | 9.1 | 0.0 | W | 5.7 | 25 | 7 | 1019.2 | 64.1 | 13.8 | 0 | 0 | 0 | 0 | 0 | 0 | 27 |
| 28 | 18.2 | 8.1 | 5.9 | 17.9 | 7.2 | 0.0 | NW | 4.1 | 21 | 7 | 1022.8 | 64.7 | 13.0 | 0 | 0 | 0 | 0 | 0 | 0 | 28 |
| 29 | 19.4 | 8.1 | 5.5 | 17.3 | 8.9 | 0.0 | W | 5.3 | 23 | 3 | 1021.9 | 65.4 | 14.1 | 0 | 0 | 0 | 0 | 0 | 0 | 29 |
| 30 | 20.9 | 11.4 | 9.4 | 17.5 | 2.9 | 0.8 | W | 7.6 | 30 | 3 | 1014.1 | 73.7 | 15.2 | 0 | 0 | 0 | 0 | 0 | 0 | 30 |
| Mean/Total | 20.0 | 11.2 | 9.3 | 17.2 | 188.0 | 29.4 | X | 4.3 | X | 5.1 | 1014.7 | 74.0 | 15.3 | 0 | 0 | 0 | 0 | 0 | 1 | Mean/Total |
| (+0.3) | (+1.0) | (97%) | (59%) |
(*All times GMT*)
Additional Data:
Rainfall Duration 27.0 hours.
Air Frost Duration NIL hours
Differences from average:
Differences from average shown in red. Reference periods used are as follows: Temperature 25 Years 1973/1997; rainfall 30 Years 1971/2000; sunshine 30 Years 1961/1990.
Observations practice:
Note: In line with standard meteorological practice the 24 hour maximum temperature and rainfall are read at 0900 GMT and credited to the previous day i.e. data shown above for 1st actually read at 0900 GMT on 2nd and represents the previous 24 hours. The 24 hour minimum and grass minimum temperatures are similarly observed at 0900 GMT but are credited to the day of the reading (e.g. observations made at 0900 GMT on 2nd shown against 2nd and represent previous 24 hours). This is the reason why at daily update of the above table the minimum and grass minimum temperatures appear to be "ahead" of the other data mentioned. (This explanation given in response to a query received).
Graphs and Charts:
Click on the following links to view this month's graphs and charts.......
1. Daily Maximum, Minimum & Grass Minimum Temperatures
2. Daily Maximum & Minimum Temperatures (with 25 Year Comparative Means)
3. Daily Earth (30 cms Depth) Temperature @ 0900 GMT 4. Daily Rainfall 5. Daily Sunshine
6. Daily Maximum Gust & Mean Wind Speed 7. Daily Wind Direction @ 0900 GMT
8. Daily Mean MSL Air Pressure 9. Daily Mean Relative Humidity 10. Thermograph
11 . Barograph 12. Hygrograph 13. Anemograph 14. Wind Direction
15. Sunshine Duration 16. Rainfall Intensity & Duration
June 2002 Weather Review:
Click on the link below for a text report of the June 2002 weather in Royston......
June (since 1972) at Royston (Iceni) Weather Station:
Mean daily maximum temperature (25 years 1973/1997) 19.7°C
Mean daily minimum temperature (25 years 1973/1997) 10.2°C
Highest temperature 33.7°C (26th June 1976); lowest temperature 2.2°C (3rd June 1975)
Lowest grass minimum temperature -1.0°C (2nd June 1991)
Warmest June 1976 (Mean temperature 18.3°C); coldest June 1977 (Mean temperature 12.5°C)
Average June rainfall (30 years 1971/2000) 50.2 mm
Wettest June 1985 (Rainfall 135.4 mm); driest June 1996 (Rainfall 8.0 mm)
Wettest Day 19th June 1973 (Rainfall 36.8 mm);
Highest number of "rain days" (0.2 mm or more) 23 (1997); lowest number of "rain days" 3 (1976, 1996)
Highest number of days with thunder 10 (1982)
Highest number of air frosts 0
Highest number of ground frosts 2 (1989)
Highest number of days with snow falling 1 (1975)
Highest number of days with snow lying (ground with more than 50% snow cover @ 0900 GMT) 0
|
|
|
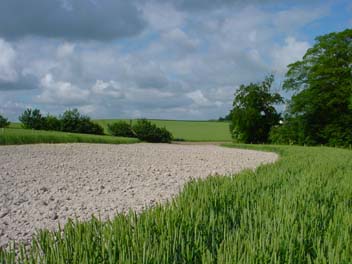
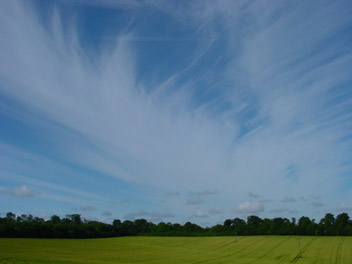
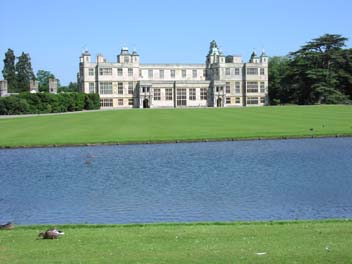
| A new water pipeline crossing the countryside to the south of Royston is now nearing completion and the site reinstated. Here at a point some 2 km SE of the town the top soil has recently been replaced on the swathe cut through a field of wheat. The photograph was taken at 0833 GMT on 11th June 2002, when the temperature was 14.5°C in a westerly breeze of 7 knots, gusting to 14 knots. As can be seen the cloud is already building up and sunshine for the day was restricted to 7.9 hours. A maximum temperature of 18.4°C was achieved. | A fine display of cirrus clouds covered the early morning sky over Royston on 23rd June 2002. This photograph (taken at 0813 GMT looking westwards over the town from the Greenwich Meridian on the northern fringe of the Burloes Estate) shows a broad band of cirrus (aligned on an axis running approximately from west to east) which was easily discernible on high resolution satellite images. The temperature is 16°C and wind speed 4 knots gusting to 10 knots (from a westerly direction). The day was fairly sunny with total sunshine of 11.7 hours. | The sight of water means that this is definitely not Royston as there is no surface drainage in or around the town! It is, in fact, Audley End House (as pictured at 1435 GMT on 26th June 2002) some 17 km from Royston on a bearing slightly south of east. Although the sky is clear in the photograph high frontal cloud is slowly encroaching from the NW and a few cumulus clouds are drifting in from the W. Overall it was a glorious Summer day with a maximum temperature of 24.5°C at Royston and a sunshine total of 15.3 hours. |
Return to Welcome to Royston (Iceni) Weather Station page
( This page last updated 1st July 2002 2109 GMT)