

Royston (Iceni) Weather Station
Daily Weather Observations - July 2002
| Date | Max | Min | Grass | Earth | Sunshine | Rainfall | Wind | Mean | Max | Cloud | Mean | Mean | Mean | Fog | Fog | Snow | Snow | Hail | Thunder | Date |
| Temp | Temp | Min | (30cm) | (Hrs) | (MM) | Direc- | Wind | Gust | Cover | MSL | Rel. | Temp | (vis.< | (vis.< | or | Lying | 00/00h | 00/00h | ||
| (°C) | (°C) | Temp | Temp | 00/00h | 09/09h | tion | Speed | Speed | (Oktas) | Pressure | Humd | (°C) | 1000m) | 200m | Rain/ | (>50% | ||||
| 09/09h | 09/09h | (°C) | (°C) | 09h | (mph) | (mph) | 09h | (mb) | (%) | 00/00h | 09h | 09h | Snow | cover | ||||||
| 09/09h | 09h | 00/00h | 00/00h | 00/00h | 00/00h | 00/00h | 09h) | |||||||||||||
| 1 | 18.0 | 11.0 | 10.5 | 17.6 | 3.0 | 5.3 | SW | 8.7 | 37 | 7 | 1000.5 | 80.5 | 13.7 | 0 | 0 | 0 | 0 | 0 | 0 | 1 |
| 2 | 17.9 | 10.4 | 8.9 | 17.0 | 4.1 | 12.3 | W | 7.6 | 30 | 7 | 999.1 | 75.7 | 13.4 | 0 | 0 | 0 | 0 | 0 | 0 | 2 |
| 3 | 16.5 | 10.6 | 10.0 | 16.9 | 0.7 | 4.4 | N | 1.9 | 21 | 8 | 998.7 | 92.9 | 11.9 | 0 | 0 | 0 | 0 | 0 | 1 | 3 |
| 4 | 19.2 | 10.1 | 8.8 | 16.4 | 5.5 | 1.9 | W | 4.8 | 23 | 2 | 1014.8 | 73.6 | 14.7 | 0 | 0 | 0 | 0 | 0 | 0 | 4 |
| 5 | 17.5 | 11.7 | 11.2 | 17.2 | 0.9 | 6.7 | S | 3.0 | 23 | 8 | 1009.2 | 94.3 | 13.8 | 0 | 0 | 0 | 0 | 0 | 1 | 5 |
| 6 | 18.5 | 12.0 | 12.1 | 17.0 | 0.9 | TR | N | 1.2 | 16 | 7 | 1015.1 | 81.5 | 14.7 | 0 | 0 | 0 | 0 | 0 | 0 | 6 |
| 7 | 19.5 | 13.5 | 13.0 | 17.3 | 3.5 | TR | SW | 5.7 | 23 | 8 | 1013.7 | 81.0 | 16.0 | 0 | 0 | 0 | 0 | 0 | 0 | 7 |
| 8 | 20.4 | 15.0 | 14.0 | 17.4 | 0.3 | 16.0 | SW | 6.2 | 32 | 8 | 1007.4 | 88.3 | 16.5 | 0 | 0 | 0 | 0 | 0 | 0 | 8 |
| 9 | 20.6 | 15.0 | 14.1 | 17.6 | 2.7 | 1.5 | S | 4.6 | 30 | 8 | 1003.7 | 88.7 | 16.3 | 0 | 0 | 0 | 0 | 0 | 0 | 9 |
| 10 | 19.9 | 10.3 | 9.3 | 17.3 | 8.1 | 1.4 | SW | 4.6 | 25 | 3 | 1009.0 | 79.5 | 13.7 | 0 | 0 | 0 | 0 | 0 | 0 | 10 |
| 11 | 20.1 | 10.2 | 8.8 | 17.0 | 10.4 | 2.4 | SW | 5.2 | 30 | 4 | 1016.1 | 77.4 | 14.3 | 0 | 0 | 0 | 0 | 0 | 0 | 11 |
| 12 | 18.2 | 9.9 | 8.9 | 17.1 | 4.0 | TR | S | 2.0 | 16 | 6 | 1019.8 | 81.4 | 13.7 | 0 | 0 | 0 | 0 | 0 | 0 | 12 |
| 13 | 22.5 | 9.5 | 7.0 | 16.9 | 13.9 | 0.0 | N | 1.3 | 16 | 0 | 1021.6 | 67.2 | 15.7 | 0 | 0 | 0 | 0 | 0 | 0 | 13 |
| 14 | 24.6 | 9.0 | 6.4 | 17.5 | 15.0 | 0.0 | N | 1.0 | 14 | 0 | 1026.9 | 63.8 | 17.3 | 0 | 0 | 0 | 0 | 0 | 0 | 14 |
| 15 | 26.1 | 11.7 | 9.2 | 18.3 | 13.2 | 0.0 | N | 1.2 | 14 | 0 | 1024.9 | 64.5 | 19.2 | 0 | 0 | 0 | 0 | 0 | 0 | 15 |
| 16 | 24.0 | 16.3 | 14.1 | 19.4 | 7.5 | 0.0 | N | 1.1 | 16 | 1 | 1021.3 | 71.5 | 19.6 | 0 | 0 | 0 | 0 | 0 | 0 | 16 |
| 17 | 22.4 | 11.1 | 9.4 | 19.2 | 6.9 | 0.0 | NW | 2.3 | 16 | 1 | 1020.9 | 72.9 | 17.1 | 0 | 0 | 0 | 0 | 0 | 0 | 17 |
| 18 | 22.6 | 13.3 | 11.1 | 19.5 | 2.6 | 0.0 | NE | 1.2 | 14 | 3 | 1021.5 | 76.7 | 17.0 | 0 | 0 | 0 | 0 | 0 | 0 | 18 |
| 19 | 23.4 | 11.6 | 10.1 | 19.2 | 10.1 | 0.0 | SE | 1.8 | 18 | 0 | 1019.7 | 66.7 | 17.0 | 0 | 0 | 0 | 0 | 0 | 0 | 19 |
| 20 | 21.3 | 13.1 | 12.1 | 19.4 | 3.6 | 0.5 | W | 1.9 | 18 | 6 | 1015.2 | 69.0 | 16.2 | 0 | 0 | 0 | 0 | 0 | 1 | 20 |
| 21 | 19.1 | 9.8 | 7.8 | 18.9 | 0.5 | 0.0 | NW | 2.5 | 21 | 8 | 1018.8 | 83.8 | 13.5 | 0 | 0 | 0 | 0 | 0 | 0 | 21 |
| 22 | 21.7 | 10.1 | 7.0 | 18.1 | 4.0 | TR | SW | 4.4 | 23 | 7 | 1019.6 | 69.8 | 16.1 | 0 | 0 | 0 | 0 | 0 | 0 | 22 |
| 23 | 22.0 | 13.9 | 11.8 | 18.4 | 1.6 | 0.2 | SW | 7.3 | 39 | 8 | 1011.5 | 82.0 | 17.5 | 0 | 0 | 0 | 0 | 0 | 0 | 23 |
| 24 | 20.5 | 13.5 | 11.7 | 18.4 | 4.7 | 0.0 | NW | 2.9 | 23 | 4 | 1016.2 | 70.7 | 16.6 | 0 | 0 | 0 | 0 | 0 | 0 | 24 |
| 25 | 24.2 | 11.9 | 10.0 | 18.4 | 9.0 | 0.0 | W | 4.3 | 21 | 2 | 1015.9 | 69.0 | 18.1 | 0 | 0 | 0 | 0 | 0 | 0 | 25 |
| 26 | 28.6 | 16.2 | 15.0 | 19.1 | 12.0 | 0.0 | W | 4.5 | 18 | 5 | 1015.9 | 66.4 | 21.7 | 0 | 0 | 0 | 0 | 0 | 0 | 26 |
| 27 | 25.8 | 15.5 | 14.0 | 20.1 | 7.8 | 0.0 | SW | 3.8 | 23 | 8 | 1017.4 | 71.7 | 20.5 | 0 | 0 | 0 | 0 | 0 | 0 | 27 |
| 28 | 29.8 | 16.5 | 13.7 | 20.1 | 10.1 | 0.0 | NW | 1.0 | 16 | 0 | 1017.9 | 68.3 | 22.6 | 0 | 0 | 0 | 0 | 0 | 0 | 28 |
| 29 | 30.8 | 16.7 | 14.7 | 20.7 | 7.6 | 0.0 | NW | 0.9 | 18 | 3 | 1017.4 | 71.5 | 23.1 | 0 | 0 | 0 | 0 | 0 | 1 | 29 |
| 30 | 24.8 | 17.2 | 15.3 | 21.1 | 3.7 | 48.8 | CALM | 0.4 | 12 | 8 | 1011.0 | 84.5 | 20.4 | 0 | 0 | 0 | 0 | 0 | 1 | 30 |
| 31 | 21.9 | 16.9 | 9.5 | 20.6 | 2.6 | 3.3 | W | 1.0 | 18 | 8 | 1007.6 | 93.0 | 18.1 | 0 | 0 | 0 | 0 | 0 | 1 | 31 |
| Mean/Total | 22.0 | 12.7 | 11.0 | 18.4 | 180.1 | 104.7 | X | 3.2 | X | 4.8 | 1014.5 | 76.7 | 16.8 | 0 | 0 | 0 | 0 | 0 | 6 | Mean/Total |
| (-0.2) | (+0.2) | (97%) | (242%) |
(*All times GMT*)
Additional Data:
Rainfall Duration 58.4 hours
Air Frost Duration NIL hours
Differences from average:
Differences from average shown in red. Reference periods used are as follows: Temperature 25 Years 1973/1997; rainfall 30 Years 1971/2000; sunshine 30 Years 1961/1990.
Observations practice:
Note: In line with standard meteorological practice the 24 hour maximum temperature and rainfall are read at 0900 GMT and credited to the previous day i.e. data shown above for 1st actually read at 0900 GMT on 2nd and represents the previous 24 hours. The 24 hour minimum and grass minimum temperatures are similarly observed at 0900 GMT but are credited to the day of the reading (e.g. observations made at 0900 GMT on 2nd shown against 2nd and represent previous 24 hours). This is the reason why at daily update of the above table the minimum and grass minimum temperatures appear to be "ahead" of the other data mentioned. (This explanation given in response to a query received).
Graphs & Charts
Click on the links below to access this months graphs and charts.......
1. Daily Maximum, Minimum & Grass Minimum Temperatures
2. Daily Maximum & Minimum Temperatures (with 25 Year Comparative Means)
3. Daily Earth (30 cms Depth) Temperature @ 0900 GMT 4. Daily Rainfall 5. Daily Sunshine
6. Daily Maximum Gust & Mean Wind Speed 7. Daily Wind Direction @ 0900 GMT
8. Daily Mean MSL Air Pressure 9. Daily Mean Relative Humidity 10. Thermograph
11 . Barograph 12. Hygrograph 13. Anemograph 14. Wind Direction
15. Sunshine Duration 16. Rainfall Intensity & Duration
.......and click on the link below for a text report of the July 2002 weather in Royston
July (since 1972) at Royston (Iceni) Weather Station:
Mean day maximum temperature (25 years 1973/1997) 22.2°C
Mean night minimum temperature (25 years 1973/1997) 12.5°C
Highest temperature 33.5°C (3rd July 1976); lowest temperature 6.4°C (30th July 1977)
Lowest grass minimum temperature 2.8°C (13th July 1993)
Hottest July 1983 (Mean temperature 20.3°C); coolest July 1978 (Mean temperature 15.2°C)
Average July rainfall (35 years 1971/2000) 43.2 mm
Wettest July 1987 (Rainfall 90.4 mm); driest July 1984 (Rainfall 8.3 mm)
Wettest Day 7th July 1989 (Rainfall 28.7 mm);
Highest number of "rain days" (0.2 mm or more) 20 (1988); lowest number of "rain days" 6 (1976,1977, 1979, 1984, & 1990)
Highest number of days with thunder 6 (1975, 1982, & 1983)
|
|
|
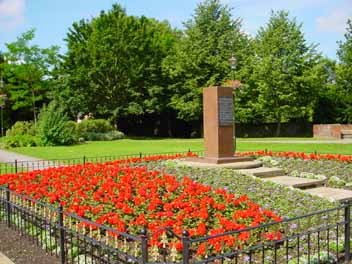
| Whatever the season of the year the Town Hall Roundabout in Royston is always a blaze of colour and Summer 2002 is no exception. With the Town Hall itself on the right, this is the view looking westwards along Melbourn Street at 0919 GMT on 4th July 2002. In brilliant sunshine the temperature is 16°C, having risen from an overnight minimum of 10.1°C. The sunshine did not last, however, and totalled only 5.5 hours for the day (and only 18.7 hours in the first 8 days of July!). | The Priory Gardens in the centre of Royston have undergone a number of changes in the last few years and this year it has been the turn of the 1951 Festival of Britain bed for a facelift. The result of the gardeners' efforts has been this beautiful display as seen (with the 12th Century Royston Parish Church as a backdrop) at 0926 GMT on 4th July 2002. A westerly breeze of mean speed 3 knots is drifting across the gardens in the bright sunshine. The maximum temperature for the day was 19.2°C. | The flowerbed surrounding the memorial to the 91st Bombardment Group of the U S. 8th Air Force in Priory Gardens, Royston has recently had a border of attractive low railings installed. and is viewed here appropriately on Independence Day, 4th July 2002. The sunshine in the photograph does not point to any great Summer warmth at this time since the temperature did not reach the 25 Year mean daily maximum value on any day in the first 12 days of the month. |
Return to Welcome to Royston (Iceni) Weather Station page
(This page last updated 12th August 2002 2007 GMT)