
Royston (Iceni) Weather Station
Daily Weather Observations - September 2002
| Date | Max | Min | Grass | Earth | Sunshine | Rainfall | Wind | Mean | Max | Cloud | Mean | Mean | Mean | Fog | Fog | Snow | Snow | Hail | Thunder | Date |
| Temp | Temp | Min | (30cm) | (Hrs) | (MM) | Direc- | Wind | Gust | Cover | MSL | Rel. | Temp | (vis.< | (vis.< | or | Lying | 00/00h | 00/00h | ||
| (°C) | (°C) | Temp | Temp | 00/00h | 09/09h | tion | Speed | Speed | (Oktas) | Pressure | Humd | (°C) | 1000m) | 200m | Rain/ | (>50% | ||||
| 09/09h | 09/09h | (°C) | (°C) | 09h | (mph) | (mph) | 09h | (mb) | (%) | 00/00h | 09h | 09h | Snow | cover | ||||||
| 09/09h | 09h | 00/00h | 00/00h | 00/00h | 00/00h | 00/00h | 09h) | |||||||||||||
| 1 | 21.2 | 7.0 | 4.6 | 18.0 | 11.7 | 0.0 | N | 0.4 | 14 | 0 | 1031.3 | 68.5 | 13.7 | 0 | 0 | 0 | 0 | 0 | 0 | 1 |
| 2 | 22.2 | 8.1 | 5.6 | 17.5 | 7.8 | 0.0 | N | 0.5 | 16 | 1 | 1028.2 | 74.1 | 14.6 | 0 | 0 | 0 | 0 | 0 | 0 | 2 |
| 3 | 23.6 | 10.4 | 8.0 | 17.3 | 6.9 | 0.0 | NE | 0.7 | 16 | 5 | 1017.8 | 77.1 | 15.5 | 0 | 0 | 0 | 0 | 0 | 0 | 3 |
| 4 | 23.0 | 9.0 | 6.4 | 17.2 | 4.9 | 0.0 | CALM | 0.4 | 12 | 8 | 1011.9 | 77.3 | 14.9 | 1 | 1 | 0 | 0 | 0 | 0 | 4 |
| 5 | 23.0 | 11.1 | 8.4 | 17.4 | 7.7 | 0.3 | SW | 4.3 | 23 | 6 | 1012.7 | 67.3 | 17.7 | 0 | 0 | 0 | 0 | 0 | 0 | 5 |
| 6 | 22.5 | 14.9 | 14.0 | 17.8 | 6.3 | 0.9 | SW | 7.9 | 41 | 4 | 1010.7 | 77.0 | 17.9 | 0 | 0 | 0 | 0 | 0 | 0 | 6 |
| 7 | 20.9 | 12.9 | 12.4 | 18.0 | 5.7 | 0.0 | SW | 4.1 | 23 | 4 | 1007.3 | 75.7 | 15.6 | 0 | 0 | 0 | 0 | 0 | 0 | 7 |
| 8 | 20.0 | 10.2 | 7.2 | 17.5 | 4.5 | 1.5 | S | 1.7 | 16 | 6 | 1007.9 | 79.7 | 14.0 | 0 | 0 | 0 | 0 | 0 | 0 | 8 |
| 9 | 17.5 | 9.2 | 6.3 | 17.0 | 0.6 | 32.9 | CALM | 2.5 | 30 | 8 | 1007.4 | 97.5 | 12.5 | 0 | 0 | 0 | 0 | 0 | 0 | 9 |
| 10 | 20.9 | 10.0 | 8.7 | 16.0 | 11.4 | 0.0 | SW | 2.6 | 18 | 0 | 1020.4 | 77.9 | 14.3 | 0 | 0 | 0 | 0 | 0 | 0 | 10 |
| 11 | 21.5 | 9.0 | 6.0 | 16.3 | 6.4 | 0.0 | CALM | 0.9 | 16 | 0 | 1026.8 | 81.5 | 15.2 | 0 | 0 | 0 | 0 | 0 | 0 | 11 |
| 12 | 22.1 | 14.2 | 12.0 | 17.0 | 7.2 | 0.0 | NE | 1.8 | 18 | 7 | 1026.3 | 84.5 | 17.0 | 0 | 0 | 0 | 0 | 0 | 0 | 12 |
| 13 | 24.5 | 12.0 | 8.7 | 17.0 | 10.1 | 0.0 | NE | 2.6 | 21 | 1 | 1026.7 | 82.7 | 17.3 | 0 | 0 | 0 | 0 | 0 | 0 | 13 |
| 14 | 16.5 | 13.9 | 11.2 | 17.5 | 0.1 | TR | NE | 2.3 | 21 | 8 | 1027.9 | 83.9 | 14.8 | 0 | 0 | 0 | 0 | 0 | 0 | 14 |
| 15 | 17.3 | 12.1 | 12.2 | 17.0 | 0.4 | 0.0 | N | 1.2 | 18 | 8 | 1026.5 | 78.2 | 14.0 | 0 | 0 | 0 | 0 | 0 | 0 | 15 |
| 16 | 16.5 | 9.3 | 5.6 | 16.7 | 0.1 | TR | N | 0.5 | 12 | 8 | 1023.1 | 82.9 | 12.6 | 0 | 0 | 0 | 0 | 0 | 0 | 16 |
| 17 | 17.0 | 11.1 | 11.2 | 16.4 | 0.1 | 0.0 | N | 0.7 | 14 | 8 | 1020.6 | 85.6 | 13.7 | 0 | 0 | 0 | 0 | 0 | 0 | 17 |
| 18 | 15.8 | 9.0 | 5.6 | 16.2 | 0.1 | TR | CALM | 0.5 | 12 | 8 | 1018.4 | 85.4 | 12.7 | 0 | 0 | 0 | 0 | 0 | 0 | 18 |
| 19 | 18.2 | 11.4 | 11.0 | 16.0 | 1.4 | 0.0 | NE | 0.4 | 12 | 6 | 1018.2 | 81.9 | 14.2 | 0 | 0 | 0 | 0 | 0 | 0 | 19 |
| 20 | 18.0 | 11.6 | 10.4 | 16.2 | 0.2 | 0.0 | CALM | 0.1 | 9 | 8 | 1021.9 | 72.4 | 13.8 | 0 | 0 | 0 | 0 | 0 | 0 | 20 |
| 21 | 18.8 | 10.1 | 8.1 | 16.4 | 6.4 | 0.0 | N | 0.4 | 14 | 4 | 1020.1 | 74.7 | 13.7 | 0 | 0 | 0 | 0 | 0 | 0 | 21 |
| 22 | 16.5 | 9.5 | 6.8 | 16.0 | 4.3 | 0.9 | N | 2.3 | 28 | 8 | 1018.7 | 81.2 | 11.9 | 0 | 0 | 0 | 0 | 0 | 0 | 22 |
| 23 | 18.2 | 8.1 | 5.3 | 15.2 | 6.9 | TR | NE | 1.9 | 23 | 1 | 1023.3 | 78.6 | 11.4 | 0 | 0 | 0 | 0 | 0 | 0 | 23 |
| 24 | 18.0 | 4.7 | 2.1 | 14.5 | 7.5 | 0.0 | NE | 1.0 | 18 | 6 | 1026.2 | 78.3 | 10.5 | 0 | 0 | 0 | 0 | 0 | 0 | 24 |
| 25 | 18.9 | 8.4 | 5.5 | 14.5 | 6.5 | 1.5 | NW | 2.3 | 18 | 3 | 1022.1 | 75.0 | 12.6 | 0 | 0 | 0 | 0 | 0 | 0 | 25 |
| 26 | 17.5 | 10.2 | 8.7 | 14.8 | 8.4 | 0.0 | NW | 2.4 | 21 | 2 | 1020.3 | 74.7 | 11.9 | 0 | 0 | 0 | 0 | 0 | 0 | 26 |
| 27 | 17.0 | 8.6 | 5.5 | 14.5 | 0.1 | 0.0 | NW | 0.4 | 9 | 7 | 1026.4 | 82.9 | 13.0 | 0 | 0 | 0 | 0 | 0 | 0 | 27 |
| 28 | 19.4 | 7.7 | 4.4 | 14.6 | 6.8 | 0.0 | SE | 0.7 | 14 | 1 | 1028.6 | 80.7 | 13.2 | 0 | 0 | 0 | 0 | 0 | 0 | 28 |
| 29 | 19.5 | 10.2 | 6.1 | 14.5 | 8.7 | 0.0 | S | 2.2 | 21 | 6 | 1026.6 | 80.1 | 13.6 | 1 | 0 | 0 | 0 | 0 | 0 | 29 |
| 30 | 20.7 | 10.1 | 6.2 | 14.4 | 9.2 | 0.0 | SE | 2.3 | 16 | 4 | 1023.1 | 73.2 | 14.5 | 0 | 0 | 0 | 0 | 0 | 0 | 30 |
| Mean/Total | 19.6 | 10.1 | 7.8 | 16.3 | 158.1 | 38.0 | X | 1.7 | X | 4.9 | 1020.9 | 79.0 | 14.1 | 2 | 1 | 0 | 0 | 0 | 0 | Mean/Total |
| (+1.0) | (-0.3) | (110%) | (66%) |
(*All times GMT*)
Additional Data:
Rainfall Duration 16.6 hours
Air Frost Duration NIL hours
Differences from average:
Differences from average shown in red. Reference periods used are as follows: Temperature 25 Years 1973/1997; rainfall 30 Years 1971/2000; sunshine 30 Years 1961/1990.
Observations practice:
Note: In line with standard meteorological practice the 24 hour maximum temperature and rainfall are read at 0900 GMT and credited to the previous day i.e. data shown above for 1st actually read at 0900 GMT on 2nd and represents the previous 24 hours. The 24 hour minimum and grass minimum temperatures are similarly observed at 0900 GMT but are credited to the day of the reading (e.g. observations made at 0900 GMT on 2nd shown against 2nd and represent previous 24 hours). This is the reason why at daily update of the above table the minimum and grass minimum temperatures appear to be "ahead" of the other data mentioned. (This explanation given in response to a query received).
Graphs and Charts:
Click on the following links to view this month's graphs and charts.....
1. Daily Maximum, Minimum & Grass Minimum Temperatures
2. Daily Maximum & Minimum Temperatures (with 25 Year Comparative Means)
3. Daily Earth (30 cms Depth) Temperature @ 0900 GMT 4. Daily Rainfall 5. Daily Sunshine
6. Daily Maximum Gust & Mean Wind Speed 7. Daily Wind Direction @ 0900 GMT
8. Daily Mean MSL Air Pressure 9. Daily Mean Relative Humidity 10. Thermograph
11 . Barograph 12. Hygrograph 13. Anemograph 14. Wind Direction
15. Sunshine Duration 16. Rainfall Intensity & Duration
September 2002 Weather Review:
......and click on the link below for a text report of the September 2002 weather in Royston
September (since 1972) at Royston (Iceni) Weather Station:
Mean day maximum temperature (25 years 1973/1997) 18.6°C
Mean night minimum temperature (25 years 1973/1997) 10.4°C
Highest temperature 29.6°C (5th September 1973); lowest temperature 2.0°C (22nd September 1979)
Lowest grass minimum temperature -1.4°C (30th September 1988)
Hottest September 1999 (Mean temperature 17.0°C); coolest September 1972 (Mean temperature 12.0°C)
Average September rainfall (30 years 1971/2000) 57.2 mm
Wettest September 1995 (Rainfall 138.7 mm); driest September 1996 (Rainfall 11.8 mm)
Wettest Day 22nd September 1992 (Rainfall 78.1 mm);
Highest number of "rain days" (0.2 mm or more) 21 (1974, 1995); lowest number of "rain days" 5 (1986)
Highest number of days with thunder 6 (1984)
|
|
|
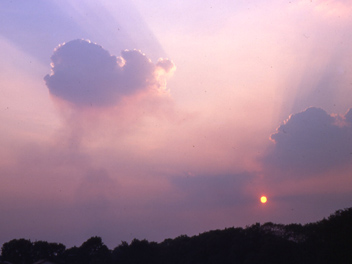
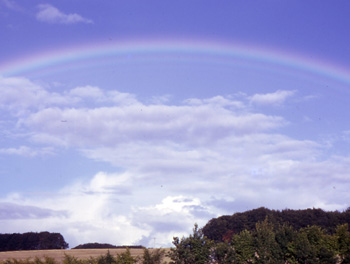
| This picture, which was taken on 11th August 1976 from the eastern boundary of Royston looking over the town, recalls the now discontinued practice of post harvest stubble burning in the late Summer and early Autumn. Here the smoke from the fields has risen in the calm conditions to form the small cloud seen at the upper left of the photograph. This was the 8th consecutive day without measurable rainfall in a very dry, hot Summer so conditions for controlled burning would have been ideal. The maximum temperature for the day was 24.8°C. | The geranium pyramids which adorn the Cross at Royston have been very attractive again this year. This was the view at 0927 GMT on 11th September 2002 looking from the northern side of the Cross towards The Old Post Office P. H. in the background. This building was formerly a Crown Post Office until its change of use several years ago. The bright sunshine was continuous until noon GMT, but the day was mainly cloudy thereafter (daily sunshine total 6.4 hours). The temperature was 17°C and later rose to a maximum for the day of 21.5°C (at 1140 GMT). | This rainbow was viewed from Hyde Hill to the east of Royston during the afternoon of 23rd September 1973. The shower cloud in evidence near the horizon was but one such example on a rather cool day (maximum temperature 15.7°C). The rainfall total of 0.8 millimetres that day suggests that Royston escaped any heavy showers, however. This part of Hyde Hill is now effectively cut off from Royston since the deep cutting was made in the hill in 1981 to accommodate the A505 Royston by-pass (which opened in 1982). |
Return to Welcome to Royston (Iceni) Weather Station page
(This page last updated 1st October 2002 2025 GMT)