Royston (Iceni) Weather Station
Daily Weather Observations - November 2002
| Date | Max | Min | Grass | Earth | Sunshine | Rainfall | Wind | Mean | Max | Cloud | Mean | Mean | Mean | Fog | Fog | Snow | Snow | Hail | Thunder | Date |
| Temp | Temp | Min | (30cm) | (Hrs) | (MM) | Direc- | Wind | Gust | Cover | MSL | Rel. | Temp | (vis.< | (vis.< | or | Lying | 00/00h | 00/00h | ||
| (°C) | (°C) | Temp | Temp | 00/00h | 09/09h | tion | Speed | Speed | (Oktas) | Pressure | Humd | (°C) | 1000m) | 200m | Rain/ | (>50% | ||||
| 09/09h | 09/09h | (°C) | (°C) | 09h | (mph) | (mph) | 09h | (mb) | (%) | 00/00h | 09h | 09h | Snow | cover | ||||||
| 09/09h | 09h | 00/00h | 00/00h | 00/00h | 00/00h | 00/00h | 09h) | |||||||||||||
| 1 | 14.5 | 10.5 | 9.9 | 10.6 | 0.2 | 2.5 | S | 5.6 | 25 | 8 | 1011.5 | 95.0 | 12.3 | 0 | 0 | 0 | 0 | 0 | 0 | 1 |
| 2 | 15.4 | 10.0 | 7.5 | 10.9 | 0.8 | 11.4 | SW | 4.9 | 25 | 7 | 1006.6 | 96.9 | 12.0 | 0 | 0 | 0 | 0 | 0 | 0 | 2 |
| 3 | 13.1 | 9.6 | 7.2 | 11.2 | 7.0 | 0.0 | SW | 6.9 | 35 | 2 | 1004.0 | 86.0 | 10.5 | 0 | 0 | 0 | 0 | 0 | 0 | 3 |
| 4 | 12.9 | 6.9 | 4.7 | 10.5 | 7.9 | TR | W | 3.5 | 18 | 1 | 1016.8 | 86.1 | 8.6 | 0 | 0 | 0 | 0 | 0 | 0 | 4 |
| 5 | 14.1 | 7.6 | 4.6 | 9.8 | 0.3 | 3.9 | S | 5.1 | 23 | 8 | 1022.0 | 93.4 | 11.2 | 0 | 0 | 0 | 0 | 0 | 0 | 5 |
| 6 | 12.9 | 12.3 | 11.6 | 10.7 | 0.0 | 12.8 | S | 5.4 | 32 | 8 | 1013.0 | 94.9 | 10.4 | 0 | 0 | 0 | 0 | 0 | 0 | 6 |
| 7 | 9.3 | 4.5 | 1.3 | 10.2 | 5.3 | 1.6 | W | 5.7 | 25 | 1 | 1017.0 | 82.2 | 5.9 | 0 | 0 | 0 | 0 | 0 | 0 | 7 |
| 8 | 13.4 | 4.1 | 1.9 | 9.2 | 0.0 | 6.9 | SW | 8.8 | 41 | 8 | 1005.9 | 94.8 | 8.7 | 0 | 0 | 0 | 0 | 0 | 0 | 8 |
| 9 | 9.9 | 5.8 | 4.0 | 9.6 | 2.3 | 5.5 | NW | 1.4 | 16 | 4 | 1006.7 | 93.2 | 7.0 | 0 | 0 | 0 | 0 | 0 | 0 | 9 |
| 10 | 13.9 | 6.6 | 6.1 | 9.4 | 0.1 | 3.3 | S | 5.0 | 30 | 8 | 1002.1 | 96.6 | 9.0 | 0 | 0 | 0 | 0 | 0 | 0 | 10 |
| 11 | 12.6 | 7.0 | 4.9 | 9.5 | 6.9 | 2.7 | SW | 6.7 | 28 | 0 | 1002.7 | 89.1 | 9.0 | 0 | 0 | 0 | 0 | 0 | 0 | 11 |
| 12 | 11.0 | 8.8 | 7.0 | 9.2 | 1.1 | 10.3 | S | 6.6 | 32 | 8 | 998.5 | 94.4 | 9.0 | 0 | 0 | 0 | 0 | 0 | 0 | 12 |
| 13 | 10.4 | 6.6 | 4.7 | 9.1 | 2.6 | 8.1 | W | 2.5 | 28 | 8 | 988.3 | 94.8 | 8.2 | 1 | 0 | 0 | 0 | 0 | 0 | 13 |
| 14 | 12.6 | 8.6 | 7.4 | 9.1 | 5.1 | 1.8 | SW | 8.5 | 46 | 7 | 976.8 | 87.8 | 9.2 | 0 | 0 | 0 | 0 | 0 | 0 | 14 |
| 15 | 12.4 | 6.3 | 3.3 | 8.9 | 3.7 | TR | S | 2.0 | 18 | 6 | 989.9 | 93.3 | 9.0 | 0 | 0 | 0 | 0 | 0 | 0 | 15 |
| 16 | 9.0 | 4.7 | 0.2 | 8.9 | 0.8 | TR | CALM | 0.3 | 9 | 8 | 1000.2 | 99.1 | 6.7 | 1 | 1 | 0 | 0 | 0 | 0 | 16 |
| 17 | 8.0 | 7.3 | 7.0 | 9.0 | 0.0 | 3.3 | CALM | 0.1 | 7 | 8 | 1008.2 | 99.3 | 6.8 | 0 | 0 | 0 | 0 | 0 | 0 | 17 |
| 18 | 8.0 | 1.5 | -2.4 | 8.6 | 7.2 | 0.2 | CALM | 0.2 | 9 | 0 | 1012.9 | 97.6 | 3.7 | 0 | 0 | 0 | 0 | 0 | 0 | 18 |
| 19 | 9.2 | 3.4 | 2.1 | 7.6 | 3.4 | 0.0 | E | 1.4 | 18 | 8 | 1011.1 | 93.5 | 5.5 | 0 | 0 | 0 | 0 | 0 | 0 | 19 |
| 20 | 10.3 | 4.5 | 1.1 | 7.8 | 0.0 | 1.7 | SE | 3.5 | 28 | 8 | 1003.0 | 93.9 | 7.6 | 0 | 0 | 0 | 0 | 0 | 0 | 20 |
| 21 | 10.8 | 8.8 | 7.9 | 8.4 | 0.0 | 5.0 | SE | 3.5 | 23 | 8 | 987.8 | 96.8 | 8.9 | 0 | 0 | 0 | 0 | 0 | 0 | 21 |
| 22 | 10.7 | 7.1 | 4.9 | 8.5 | 3.9 | 2.9 | SE | 5.2 | 32 | 0 | 991.3 | 95.6 | 7.8 | 0 | 0 | 0 | 0 | 0 | 0 | 22 |
| 23 | 10.0 | 5.8 | 2.6 | 8.1 | 1.3 | 1.4 | SE | 2.6 | 21 | 7 | 998.7 | 97.3 | 7.2 | 0 | 0 | 0 | 0 | 0 | 0 | 23 |
| 24 | 9.4 | 4.9 | 0.5 | 7.7 | 1.1 | 5.5 | S | 1.5 | 14 | 3 | 1003.6 | 97.3 | 6.7 | 0 | 0 | 0 | 0 | 0 | 1 | 24 |
| 25 | 7.9 | 4.9 | 2.4 | 7.6 | 0.0 | TR | CALM | 0.7 | 12 | 8 | 1005.7 | 99.8 | 6.1 | 1 | 1 | 0 | 0 | 0 | 0 | 25 |
| 26 | 10.3 | 3.5 | 1.2 | 7.9 | 4.0 | 0.0 | S | 3.4 | 23 | 8 | 1010.7 | 98.9 | 6.2 | 1 | 0 | 0 | 0 | 0 | 0 | 26 |
| 27 | 10.3 | 6.1 | 4.0 | 7.6 | 4.3 | 0.4 | SE | 7.2 | 35 | 2 | 1006.3 | 93.2 | 7.8 | 0 | 0 | 0 | 0 | 0 | 0 | 27 |
| 28 | 11.8 | 7.8 | 5.0 | 7.8 | 2.2 | 1.4 | S | 3.7 | 18 | 3 | 1004.4 | 96.6 | 8.6 | 0 | 0 | 0 | 0 | 0 | 0 | 28 |
| 29 | 8.0 | 5.8 | 3.5 | 7.8 | 0.0 | 0.0 | SW | 1.6 | 14 | 7 | 1011.5 | 99.3 | 6.7 | 0 | 0 | 0 | 0 | 0 | 0 | 29 |
| 30 | 11.2 | 6.0 | 5.9 | 8.0 | 0.1 | 5.4 | SW | 3.0 | 18 | 7 | 1018.9 | 97.9 | 7.4 | 0 | 0 | 0 | 0 | 0 | 0 | 30 |
| Mean/Total | 11.1 | 6.6 | 4.4 | 9.0 | 71.4 | 98.0 | X | 3.9 | X | 5.6 | 1004.5 | 94.5 | 8.1 | 4 | 2 | 0 | 0 | 0 | 1 | Mean/Total |
| (+1.6) | (+2.0) | (107%) | (187%) |
(*All times GMT*)
Additional Data:
Rainfall Duration 115.8 hours
Air Frost Duration NIL hours
Differences from average:
Differences from average shown in red. Reference periods used are as follows: Temperature 25 Years 1973/1997; rainfall 30 Years 1971/2000; sunshine 30 Years 1961/1990.
Observations practice:
Note: In line with standard meteorological practice the 24 hour maximum temperature and rainfall are read at 0900 GMT and credited to the previous day i.e. data shown above for 1st actually read at 0900 GMT on 2nd and represents the previous 24 hours. The 24 hour minimum and grass minimum temperatures are similarly observed at 0900 GMT but are credited to the day of the reading (e.g. observations made at 0900 GMT on 2nd shown against 2nd and represent previous 24 hours). This is the reason why at daily update of the above table the minimum a grass minimum temperatures appear to be "ahead" of the other data mentioned. (This explanation given in response to a query received).
Graphs and Charts:
Click on the following links to view this month's graphs and charts.....
1. Daily Maximum, Minimum & Grass Minimum Temperatures
2. Daily Maximum & Minimum Temperatures (with 25 Year Comparative Means)
3. Daily Earth (30 cms Depth) Temperature @ 0900 GMT 4. Daily Rainfall 5. Daily Sunshine
6. Daily Maximum Gust & Mean Wind Speed 7. Daily Wind Direction @ 0900 GMT
8. Daily Mean MSL Air Pressure 9. Daily Mean Relative Humidity 10. Thermograph
11 . Barograph 12. Hygrograph 13. Anemograph 14. Wind Direction
15. Sunshine Duration 16. Rainfall Intensity & Duration
November 2002 Weather Review:
......and click on the link below for a text report of the November 2002 weather in Royston
November (since 1972) at Royston (Iceni) Weather Station:
Mean day maximum temperature (25 years 1973/1997) 9.5°C
Mean night minimum temperature (25 years 1973/1997) 4.6°C
Highest temperature 17.8°C (2nd November 1984); lowest temperature -6.9°C (30th November 1978)
Lowest grass minimum temperature -10.5°C (30th November 1978)
Warmest November 1994 (Mean temperature 10.5°C); coldest November 1985 (Mean temperature 4.2°C)
Average November rainfall (30 years 1971/2000) 52.4 mm
Wettest November 2000 (Rainfall 118.2 mm); driest November 1978 (Rainfall 17.2 mm)
Wettest Day 12th November 1976 (Rainfall 28.0 mm);
Highest number of "rain days" (0.2 mm or more) 23 (1974); lowest number of "rain days" 7 (1978)
Highest number of days with thunder 2 (1974)
Highest number of air frosts 10 (1985, 1996)
Highest number of ground frosts 17 (1985, 1988)
Highest number of days with snow falling 4 (1980, 1985)
Highest number of days with snow lying (ground with more than 50% snow cover @ 0900 GMT) 5 (1988)
|
|
|
|
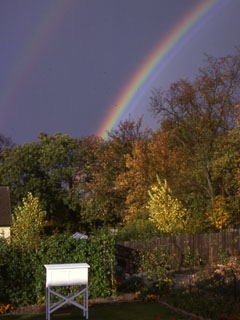
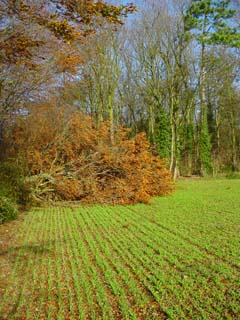
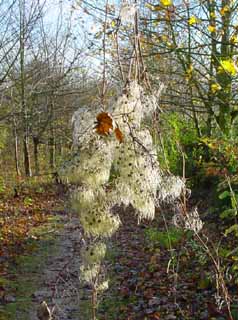
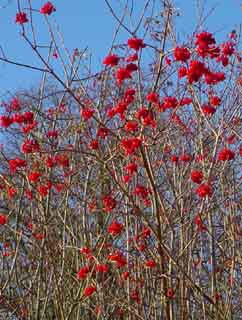
| The sunshine partly responsible for producing this striking rainbow is also illuminating the Stevenson Screen at Royston (Iceni) Weather Station in this picture taken on 1st November 1975. A secondary rainbow can just be detected at the top left hand corner of the photograph. October had been very dry (8.9 mm rainfall) and the 2.5 mm rainfall recorded on this day ended a 14 day period without any measurable rainfall. Only October 1978 has been drier since. The maximum temperature for the day was 13.8°C. | The fallen tree in this photograph (taken at 0959 GMT on 11th November 2002) depicts a familiar scene in the Royston area after the severe gale on 27th October. Here a mature beech tree on the Burloes Estate close to the B1039 Royston to Saffron Walden road has had its trunk of approximately 2/3 metre diameter snapped off some 4 metres above ground level. The temperature is 10°C, later rising to a maximum of 12.6°C, whilst the sunshine evident in the picture continued for much of the day, totalling 6.9 hours. | From a distance this looked a ghostly figure, being illuminated by the low early morning sun and swinging gently in the breeze. A closer inspection revealed it to be an example of the native climbing plant Clematis vitalba (also known as 'Travellers' Joy' or 'Old Man's Beard') suspended from a tree. The location is on the Icknield Way about 2 km east of Royston and the date and time 15th November 2002 at 0929 GMT. The wind direction is SSW and wind strength 4 knots gusting to 12 knots. The temperature is 9.3°C. | There is an abundance of berries on trees and shrubs this Autumn and this is one such example spotted in Bury Plantation on the eastern fringes of Royston on 18th November 2002 at 1010 GMT. It is often thought that a profuse collection of berries in the Autumn heralds a severe Winter (being food provision for the bird population), but it is more a reflection of past weather rather than forthcoming events. At the time of this photograph it was dead calm with a temperature of 2.5°C. The daily sunshine total was 7.2 hours. |
Return to Welcome to Royston (Iceni) Weather Station page
(This page last updated 10th December 2002 2034 GMT)