Royston (Iceni) Weather Station
Daily
Weather Observations -
December 2002
| Date |
Max |
Min |
Grass |
Earth |
Sunshine |
Rainfall |
Wind |
Mean |
Max |
Cloud |
Mean |
Mean |
Mean |
Fog |
Fog |
Snow |
Snow |
Hail |
Thunder |
Date |
| |
Temp |
Temp |
Min
|
(30cm) |
(Hrs) |
(MM) |
Direc- |
Wind |
Gust |
Cover |
MSL |
Rel. |
Temp |
(vis.< |
(vis.<
|
or
|
Lying |
00/00h |
00/00h |
|
| |
(°C) |
(°C) |
Temp |
Temp |
00/00h |
09/09h |
tion |
Speed |
Speed |
(Oktas) |
Pressure |
Humd |
(°C) |
1000m) |
200m |
Rain/
|
(>50% |
|
|
|
| |
09/09h |
09/09h |
(°C) |
(°C) |
|
|
09h |
(mph) |
(mph) |
09h |
(mb) |
(%) |
00/00h |
09h |
09h |
Snow |
cover |
|
|
| |
|
|
09/09h |
09h |
|
|
|
00/00h |
00/00h |
|
00/00h |
00/00h |
|
|
|
00/00h |
09h) |
|
|
|
| |
|
|
|
|
|
|
|
|
|
|
|
|
|
|
|
|
|
|
|
|
| 1 |
11.5 |
9.1 |
8.6 |
8.4 |
1.6 |
2.9 |
S |
7.8 |
32 |
8 |
1000.0 |
90.1 |
9.2 |
0 |
0 |
0 |
0 |
0 |
0 |
1 |
| 2 |
9.6 |
7.3 |
5.8 |
8.4 |
0.7 |
2.0 |
W |
9.5 |
35 |
6 |
997.0 |
81.7 |
8.1 |
0 |
0 |
0 |
0 |
0 |
0 |
2 |
| 3 |
9.3 |
6.6 |
4.7 |
8.1 |
0.5 |
0.7 |
SW |
2.3 |
18 |
8 |
1008.5 |
93.4 |
7.4 |
0 |
0 |
0 |
0 |
0 |
0 |
3 |
| 4 |
8.6 |
5.6 |
3.1 |
8.1 |
0.8 |
4.7 |
S |
4.6 |
28 |
8 |
1012.0 |
95.0 |
5.9 |
0 |
0 |
0 |
0 |
0 |
0 |
4 |
| 5 |
7.5 |
1.6 |
-1.6 |
7.4 |
4.2 |
0.3 |
NW |
2.5 |
21 |
7 |
1025.2 |
91.0 |
4.4 |
0 |
0 |
0 |
0 |
0 |
0 |
5 |
| 6 |
6.7 |
4.3 |
-0.2 |
7.1 |
0.0 |
0.9 |
NE |
2.4 |
18 |
8 |
1032.0 |
96.8 |
5.4 |
0 |
0 |
0 |
0 |
0 |
0 |
6 |
| 7 |
5.3 |
4.1 |
3.6 |
7.2 |
0.0 |
TR |
NE |
4.2 |
23 |
8 |
1027.6 |
92.1 |
4.0 |
0 |
0 |
0 |
0 |
0 |
0 |
7 |
| 8 |
3.2 |
2.2 |
1.9 |
7.0 |
0.0 |
TR |
NE |
3.2 |
23 |
8 |
1025.8 |
93.0 |
2.3 |
0 |
0 |
0 |
0 |
0 |
0 |
8 |
| 9 |
4.6 |
0.0 |
-2.8 |
6.5 |
6.7 |
0.0 |
NE |
3.2 |
23 |
0 |
1026.1 |
84.4 |
1.4 |
0 |
0 |
0 |
0 |
0 |
0 |
9 |
| 10 |
1.7 |
-0.4 |
-2.6 |
5.4 |
0.0 |
0.0 |
NE |
5.0 |
30 |
8 |
1023.2 |
86.6 |
0.2 |
0 |
0 |
0 |
0 |
0 |
0 |
10 |
| 11 |
1.8 |
-0.3 |
-2.0 |
5.0 |
0.1 |
0.0 |
E |
3.0 |
23 |
6 |
1021.5 |
88.0 |
0.8 |
0 |
0 |
0 |
0 |
0 |
0 |
11 |
| 12 |
5.6 |
1.0 |
0.9 |
4.9 |
0.0 |
1.1 |
NE |
0.8 |
14 |
8 |
1019.1 |
94.1 |
2.1 |
0 |
0 |
0 |
0 |
0 |
0 |
12 |
| 13 |
6.2 |
3.5 |
1.8 |
5.3 |
0.0 |
0.2 |
E |
0.3 |
14 |
8 |
1021.2 |
98.9 |
4.9 |
0 |
0 |
0 |
0 |
0 |
0 |
13 |
| 14 |
7.0 |
5.3 |
3.9 |
5.9 |
0.1 |
6.1 |
E |
1.1 |
21 |
8 |
1016.7 |
95.8 |
5.5 |
0 |
0 |
0 |
0 |
0 |
0 |
14 |
| 15 |
6.5 |
5.0 |
4.8 |
6.3 |
0.0 |
9.6 |
NE |
3.5 |
23 |
8 |
1006.5 |
99.6 |
5.3 |
0 |
0 |
0 |
0 |
0 |
0 |
15 |
| 16 |
5.5 |
4.8 |
4.7 |
6.5 |
0.0 |
2.4 |
NW |
1.5 |
14 |
8 |
1015.1 |
99.8 |
4.4 |
1 |
0 |
0 |
0 |
0 |
0 |
16 |
| 17 |
4.5 |
3.1 |
2.6 |
6.5 |
0.0 |
0.0 |
N |
0.6 |
14 |
8 |
1026.3 |
95.9 |
2.2 |
0 |
0 |
0 |
0 |
0 |
0 |
17 |
| 18 |
4.3 |
-0.7 |
-4.5 |
5.6 |
4.7 |
0.0 |
CALM |
0.2 |
14 |
1 |
1033.3 |
89.8 |
1.1 |
0 |
0 |
0 |
0 |
0 |
0 |
18 |
| 19 |
4.9 |
-0.5 |
-4.6 |
4.9 |
0.8 |
0.0 |
SE |
0.9 |
21 |
8 |
1028.1 |
94.7 |
2.0 |
0 |
0 |
0 |
0 |
0 |
0 |
19 |
| 20 |
5.1 |
-1.2 |
-5.6 |
4.5 |
0.0 |
1.3 |
S |
1.3 |
14 |
8 |
1018.3 |
97.3 |
2.1 |
0 |
0 |
0 |
0 |
0 |
0 |
20 |
| 21 |
11.1 |
3.0 |
3.0 |
4.9 |
0.0 |
18.0 |
CALM |
1.3 |
23 |
8 |
1016.4 |
99.6 |
4.4 |
1 |
1 |
0 |
0 |
0 |
0 |
21 |
| 22 |
11.1 |
7.2 |
7.0 |
5.7 |
0.1 |
0.0 |
W |
5.7 |
37 |
8 |
1005.9 |
94.5 |
9.7 |
0 |
0 |
0 |
0 |
0 |
0 |
22 |
| 23 |
11.8 |
8.2 |
6.8 |
6.7 |
0.0 |
0.5 |
SE |
4.2 |
32 |
8 |
1006.5 |
97.2 |
9.0 |
0 |
0 |
0 |
0 |
0 |
0 |
23 |
| 24 |
12.9 |
9.7 |
7.7 |
7.3 |
4.1 |
0.3 |
SW |
6.3 |
30 |
4 |
1003.8 |
94.2 |
10.6 |
0 |
0 |
0 |
0 |
0 |
0 |
24 |
| 25 |
11.0 |
8.3 |
5.1 |
7.5 |
5.9 |
3.6 |
SW |
3.5 |
21 |
5 |
1008.2 |
95.4 |
8.6 |
0 |
0 |
0 |
0 |
0 |
0 |
25 |
| 26 |
12.0 |
8.4 |
6.8 |
7.3 |
0.3 |
3.3 |
SW |
6.7 |
28 |
7 |
995.3 |
95.4 |
9.6 |
0 |
0 |
0 |
0 |
0 |
0 |
26 |
| 27 |
11.4 |
9.6 |
7.7 |
7.8 |
0.1 |
0.0 |
S |
6.0 |
30 |
2 |
989.1 |
94.7 |
9.9 |
0 |
0 |
0 |
0 |
0 |
0 |
27 |
| 28 |
9.1 |
7.2 |
4.6 |
7.8 |
0.1 |
7.3 |
W |
6.1 |
23 |
7 |
1000.3 |
89.2 |
7.3 |
0 |
0 |
0 |
0 |
0 |
0 |
28 |
| 29 |
12.4 |
4.9 |
2.7 |
7.3 |
0.0 |
8.2 |
E |
5.7 |
37 |
8 |
998.5 |
97.6 |
8.1 |
0 |
0 |
0 |
0 |
0 |
0 |
29 |
| 30 |
7.9 |
7.5 |
7.3 |
7.7 |
0.0 |
3.4 |
N |
4.7 |
46 |
8 |
999.3 |
96.9 |
7.4 |
0 |
0 |
0 |
0 |
0 |
0 |
30 |
| 31 |
6.3 |
3.0 |
2.6 |
7.6 |
0.0 |
6.7 |
NE |
1.8 |
18 |
8 |
1012.1 |
91.7 |
2.7 |
0 |
0 |
0 |
0 |
0 |
0 |
31 |
| |
|
|
|
|
|
|
|
|
|
|
|
|
|
|
|
|
|
|
|
|
| Mean/Total |
7.6 |
4.4 |
2.7 |
6.7 |
30.4 |
83.5 |
X |
3.6 |
X |
6.9 |
1013.5 |
93.7 |
5.4 |
2 |
1 |
0 |
0 |
0 |
0 |
Mean/Total |
| * |
(+0.5) |
(+1.4) |
|
|
(65%) |
(158%) |
|
|
|
|
|
|
|
|
|
|
|
|
|
|
(*All times
GMT*)
Additional Data:
Rainfall Duration 120.3
hours
Air Frost Duration 27.4
hours
Differences from
average:
Differences from
average shown in red.
Reference
periods used are as follows: Temperature
25 Years 1973/1997; rainfall
30
Years 1971/2000; sunshine
30 Years 1961/1990.
*The differences from
average quoted during the course of the month relate to the cumulative daily
averages up to the date of the last observation, not the averages for the month
as a whole.
Observations
practice:
Note:
In line with standard meteorological
practice the 24 hour maximum temperature and rainfall
are read at 0900 GMT and credited to the previous day i.e. data
shown above for 1st actually read at 0900 GMT on 2nd
and represents the previous 24 hours. The 24 hour minimum and grass
minimum temperatures are similarly observed at 0900 GMT but are
credited to the day of the reading (e.g. observations made at
0900 GMT on 2nd shown against 2nd and
represent previous 24 hours). This is the reason why at daily update of the
above table the minimum a grass minimum temperatures appear to be
"ahead" of the other data mentioned. (This explanation given in
response to a query received).
Graphs and Charts:
Click on the following
links to view this month's graphs and charts.....
1.
Daily
Maximum, Minimum & Grass Minimum Temperatures
2.
Daily
Maximum & Minimum Temperatures (with 25 Year Comparative Means)
3.
Daily
Earth (30 cms Depth) Temperature @ 0900 GMT
4.
Daily
Rainfall 5.
Daily
Sunshine
6.
Daily
Maximum Gust & Mean Wind Speed
7.
Daily
Wind Direction @ 0900 GMT
8.
Daily
Mean MSL Air Pressure
9.
Daily
Mean Relative Humidity
10.
Thermograph
11 .
Barograph
12.
Hygrograph
13.
Anemograph
14.
Wind
Direction
15.
Sunshine
Duration 16.
Rainfall
Intensity & Duration
December 2002
Weather Review:
......and click on
the link below for a text report of the December 2002 weather in Royston
December 2002 Weather Review
December (since
1972) at Royston (Iceni) Weather Station:
Mean day maximum temperature (25 years
1973/1997) 7.1°C
Mean night minimum temperature (25 years
1973/1997) 3.0°C
Highest temperature 15.1°C
(2nd December 1985); lowest temperature -9.8°C
(29th December 1995)
Lowest grass minimum temperature -14.6°C
(13th December 1981)
Warmest December 1974
(Mean temperature 7.8°C);
coldest December 1981
(Mean temperature 0.4°C)
Average December rainfall (30 years 1971/2000)
52.8 mm
Wettest December 1989
(Rainfall 122.4 mm);
driest December 1991
(Rainfall 10.3
mm)
Wettest Day 27th
December 1979 (Rainfall 31.5
mm);
Highest number of "rain days" (0.2
mm or more) 22 (1978);
lowest number of "rain days" 8
(1991)
Highest number of days with thunder 3
(1989)
Highest number of air frosts 20
(1981)
Highest number of ground frosts 25
(1981)
Highest number of days with snow falling 10
(1981)
Highest number of days with snow lying (ground with
more than 50% snow cover @ 0900 GMT) 23 (1981)
 |
 |
 |
|
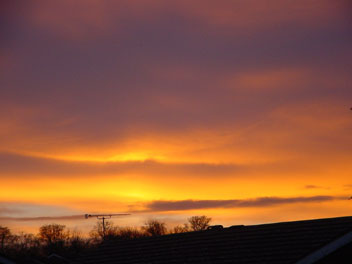
Daylight hours on a cloudy and
rather windy day on 2nd December 2002 in Royston ended with a burst of
sunshine from 1440/1520 GMT. This was followed by a brightly coloured
sunset close to the horizon, as seen in the above photograph taken at 1553
GMT. At this time the temperature was 7.7°C (after a maximum for the day
of 9.6°C); the wind direction was SW, and the mean wind speed was 5
knots, gusting to 14 knots. Whether much can be deduced about the
following day's weather from this type of sunset is debatable - in the
event it was a similarly rather cloudy and dry day on 3rd but with lighter
winds. |
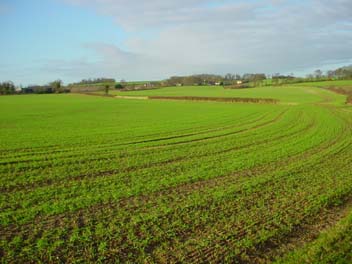
On one of the few sunny mornings in a
very dull month this was the view near Heath Farm to the SE of Royston on
5th December 2002 at 0954 GMT. It is hard to imagine that only a few
months earlier this scene was dominated by the construction of a new
underground water pipeline (click here for earlier
picture). The only trace of the existence of the earthworks is the gap in
the hedge now replaced by a wooden fence. The temperature is 4.5°C, with
a north-westerly wind of mean speed 4 knots, gusting to 10 knots. The
temperature achieved a maximum of 7.5°C for the day, after an overnight
minimum of 1.6°C, and a total of 4.2 hours sunshine was logged. |
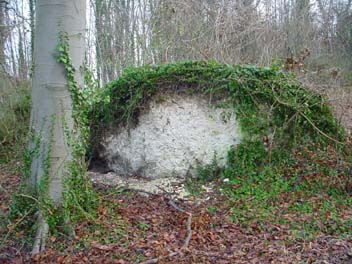
This has been an all too familiar
picture in and around Royston over the years as large trees (principally
beech) have been uprooted in gales, leaving large craters in the chalk. In
this photograph, as seen on 18th December 2002 in the plantation adjacent
to the Icknield Way at Hyde Hill, Royston the falling tree has
lifted a large ball of chalk out of the ground which over the years has
been covered in creeper (ivy). The resultant craters arising from these
incidents provide cover for small animals whilst beetles find a home in
the bark of the fallen tree trunks. When this picture was taken it was
dead calm with a temperature of 0.1°C (overnight minimum -0.7°C). |
Return to Welcome
to Royston (Iceni) Weather Station page
(This page last updated 9th January 2003 2056 GMT)