
Royston (Iceni) Weather Station
Daily Weather Observations - February 2003
(All Times GMT)
| Date | Max. Temp. (°C) 09/09h | Min. Temp. (°C) 09/09h | Grass Min. Temp. (°C) 21/09h | Earth (30cms) Temp. (°C) 09h | Sun (Hours) 00/00h | R'fall (MM) 09/09h | Wind Dir'n 09h | Mean Wind Speed (MPH) 00/00h | Max. Gust Speed (MPH) 00/00h | Cloud Cover (Oktas) 09h | Mean MSL Air Pressure (mB) 00/00h | Mean Rel. Humd. (%) 00/00h | Mean Temp. (°C) 00/00h | Fog (vis. <1000m @ 09h) | Fog (vis. <200m @ 09h) | Snow or Rain and Snow 00/00h | Snow Lying @ 09h (>50% cover) | Hail 00/00h | Thunder 00/00h | Date |
| 1 | 5.0 | -1.3 | -2.0 | 3.9 | 1.7 | 0.2 | SW | 6.0 | 28 | 8 | 1014.0 | 93.9 | 1.8 | 0 | 0 | 1 | 1 | 0 | 0 | 1 |
| 2 | 7.1 | 1.5 | 0.1 | 3.6 | 2.8 | 1.6 | SW | 9.4 | 35 | 2 | 1003.0 | 87.9 | 3.8 | 0 | 0 | 0 | 1 | 1 | 0 | 2 |
| 3 | 5.6 | 2.2 | 0.2 | 3.5 | 7.2 | 0.0 | W | 9.5 | 39 | 3 | 993.2 | 77.8 | 2.7 | 0 | 0 | 0 | 0 | 0 | 0 | 3 |
| 4 | 3.5 | -0.5 | -2.5 | 3.1 | 2.8 | 0.2 | NW | 7.2 | 32 | 1 | 1000.1 | 82.1 | 0.7 | 0 | 0 | 1 | 0 | 0 | 0 | 4 |
| 5 | 4.0 | -2.1 | -4.6 | 2.8 | 8.3 | 0.0 | W | 3.2 | 16 | 0 | 1013.3 | 83.4 | -0.4 | 0 | 0 | 0 | 0 | 0 | 0 | 5 |
| 6 | 6.9 | -1.5 | -5.5 | 2.5 | 0.0 | 0.7 | S | 5.5 | 23 | 8 | 1017.9 | 87.5 | 2.1 | 0 | 0 | 0 | 0 | 0 | 0 | 6 |
| 7 | 10.8 | 4.9 | 3.6 | 2.4 | 3.8 | 0.0 | SW | 4.8 | 21 | 6 | 1019.6 | 91.7 | 7.8 | 0 | 0 | 0 | 0 | 0 | 0 | 7 |
| 8 | 10.4 | 7.0 | 5.2 | 3.6 | 0.6 | 3.8 | SW | 5.8 | 23 | 7 | 1019.4 | 90.2 | 8.3 | 0 | 0 | 0 | 0 | 0 | 0 | 8 |
| 9 | 7.5 | 6.9 | 5.7 | 4.6 | 0.0 | 1.1 | S | 4.4 | 25 | 8 | 1015.4 | 94.1 | 6.5 | 0 | 0 | 0 | 0 | 0 | 0 | 9 |
| 10 | 6.5 | 4.2 | 3.2 | 5.0 | 0.0 | 2.0 | S | 2.6 | 18 | 8 | 1021.4 | 93.3 | 4.8 | 0 | 0 | 0 | 0 | 0 | 0 | 10 |
| 11 | 6.5 | 4.5 | 4.0 | 5.1 | 0.0 | 3.8 | S | 2.3 | 18 | 8 | 1024.9 | 97.7 | 5.2 | 0 | 0 | 0 | 0 | 0 | 0 | 11 |
| 12 | 6.0 | 5.5 | 5.1 | 5.4 | 0.0 | 0.5 | N | 0.3 | 12 | 8 | 1028.7 | 98.5 | 4.7 | 1 | 1 | 0 | 0 | 0 | 0 | 12 |
| 13 | 2.6 | 0.0 | -0.2 | 5.4 | 2.9 | 0.0 | E | 0.6 | 16 | 8 | 1028.7 | 81.9 | 0.2 | 0 | 0 | 0 | 0 | 0 | 0 | 13 |
| 14 | 4.2 | -4.6 | -8.3 | 4.5 | 8.3 | 0.0 | NE | 0.6 | 14 | 0 | 1031.7 | 89.8 | -1.5 | 0 | 0 | 0 | 0 | 0 | 0 | 14 |
| 15 | 3.9 | -4.5 | -8.6 | 3.5 | 3.7 | 0.0 | NE | 1.5 | 18 | 0 | 1037.7 | 91.0 | -0.3 | 0 | 0 | 0 | 0 | 0 | 0 | 15 |
| 16 | 4.3 | 0.1 | -0.3 | 3.0 | 4.6 | 0.0 | E | 1.2 | 18 | 8 | 1038.8 | 81.7 | 0.5 | 0 | 0 | 0 | 0 | 0 | 0 | 16 |
| 17 | 4.0 | -1.3 | -2.5 | 3.0 | 6.2 | 0.0 | E | 0.7 | 14 | 7 | 1038.5 | 80.0 | -0.4 | 0 | 0 | 0 | 0 | 0 | 0 | 17 |
| 18 | 5.2 | -6.1 | -10.0 | 2.8 | 9.3 | 0.0 | CALM | 0.7 | 18 | 0 | 1028.3 | 83.9 | -1.3 | 0 | 0 | 0 | 0 | 0 | 0 | 18 |
| 19 | 5.1 | -4.1 | -8.2 | 2.4 | 8.8 | 0.0 | E | 1.2 | 23 | 1 | 1015.3 | 79.5 | -0.3 | 0 | 0 | 0 | 0 | 0 | 0 | 19 |
| 20 | 8.7 | -0.6 | -4.3 | 2.1 | 8.0 | 0.0 | SE | 2.0 | 18 | 7 | 1013.0 | 82.1 | 2.9 | 0 | 0 | 0 | 0 | 0 | 0 | 20 |
| 21 | 12.0 | 0.9 | -3.0 | 2.0 | 9.4 | 0.0 | SE | 2.9 | 14 | 0 | 1021.9 | 84.8 | 4.8 | 0 | 0 | 0 | 0 | 0 | 0 | 21 |
| 22 | 8.9 | -1.1 | -4.5 | 2.0 | 6.8 | 0.1 | SE | 1.6 | 18 | 8 | 1022.7 | 87.8 | 2.5 | 1 | 1 | 0 | 0 | 0 | 0 | 22 |
| 23 | 13.0 | 1.9 | -0.5 | 2.0 | 5.4 | TR | S | 4.3 | 21 | 6 | 1023.3 | 88.3 | 7.0 | 0 | 0 | 0 | 0 | 0 | 0 | 23 |
| 24 | 12.4 | 3.9 | 0.9 | 2.9 | 3.5 | 0.1 | CALM | 1.4 | 18 | 8 | 1023.9 | 89.5 | 6.6 | 1 | 1 | 0 | 0 | 0 | 0 | 24 |
| 25 | 11.2 | 2.5 | -0.5 | 3.5 | 8.3 | 0.0 | SE | 1.7 | 21 | 2 | 1017.1 | 74.4 | 5.6 | 0 | 0 | 0 | 0 | 0 | 0 | 25 |
| 26 | 12.0 | 3.8 | 1.0 | 3.7 | 2.3 | 0.0 | SE | 1.1 | 16 | 3 | 1011.1 | 74.9 | 6.9 | 0 | 0 | 0 | 0 | 0 | 0 | 26 |
| 27 | 13.5 | 5.2 | 2.0 | 4.4 | 1.7 | 0.0 | SE | 3.2 | 18 | 7 | 1012.0 | 76.5 | 8.7 | 0 | 0 | 0 | 0 | 0 | 0 | 27 |
| 28 | 12.0 | 5.6 | 1.0 | 5.4 | 4.4 | 2.5 | S | 7.8 | 39 | 2 | 1014.0 | 90.5 | 8.4 | 0 | 0 | 0 | 0 | 0 | 0 | 28 |
| Total/Mean | 7.6 | 1.2 | -1.2 | 3.5 | 120.8 | 16.6 | X | 3.3 | X | 4.8 | 1019.6 | 86.2 | 3.5 | 3 | 3 | 2 | 2 | 1 | 0 | Total/Mean |
| *Diff./% | +0.4 | -0.6 | 175% | 47% | *Diff./% |
Additional Data:
Rainfall Duration 38.2 hours
Air Frost Duration 128.8 hours
Differences from average:
Differences from average shown in red. Reference periods used are as follows: Temperature 30 Years 1973/2002; rainfall 30 Years 1971/2000; sunshine 30 Years 1961/1990.
Observations practice:
Note: In line with standard meteorological practice the 24 hour maximum temperature and rainfall are read at 0900 GMT and credited to the previous day i.e. data shown above for 1st actually read at 0900 GMT on 2nd and represents the previous 24 hours. The 24 hour minimum and grass minimum temperatures are similarly observed at 0900 GMT but are credited to the day of the reading (e.g. observations made at 0900 GMT on 2nd shown against 2nd and represent previous 24 hours). This is the reason why at daily update of the above table the minimum a grass minimum temperatures appear to be "ahead" of the other data mentioned. (This explanation given in response to a query received).
Graphs and Charts:
Click on the following links to view this month's graphs and charts.....
1. Daily Maximum, Minimum & Grass Minimum Temperatures
2. Daily Maximum & Minimum Temperatures (with 25 Year Comparative Means)
3. Daily Earth (30 cms Depth) Temperature @ 0900 GMT 4. Daily Rainfall 5. Daily Sunshine
6. Daily Maximum Gust & Mean Wind Speed 7. Daily Wind Direction @ 0900 GMT
8. Daily Mean MSL Air Pressure 9. Daily Mean Relative Humidity 10. Thermograph
11 . Barograph 12. Hygrograph 13. Anemograph 14. Wind Direction
15. Sunshine Duration 16. Rainfall Intensity & Duration
February 2003 Weather Review:
......and click on the link below for a text report of the February 2003 weather in Royston
February (since 1973) at Royston (Iceni) Weather Station:
Mean day maximum temperature (30 years 1973/2002) 7.2°C
Mean night minimum temperature (30 years 1973/2002) 1.8°C
Highest temperature 18.5°C (13th February 1998); lowest temperature -10.5°C (12th & 13th February 1985)
Lowest grass minimum temperature -14.5°C (10th February 1986)
Warmest February 1990 (Mean temperature 8.1°C); coldest February 1986 (Mean temperature -1.6°C)
Average February rainfall (30 years 1971/2000) 35.0 mm
Wettest February 2001 (Rainfall 90.7 mm); driest February 1998 (Rainfall 4.8 mm)
Wettest Day 7th February 2001 (Rainfall 21.8 mm);
Highest number of "rain days" (0.2 mm or more) 21 (2000); lowest number of "rain days" 5 (1998)
Highest number of days with thunder 2 (1995)
Highest number of air frosts 24 (1986)
Highest number of ground frosts 25 (1986)
Highest number of days with snow falling 15 (1986)
Highest number of days with snow lying (ground with more than 50% snow cover @ 0900 GMT) 23 (1986)
|
|
|
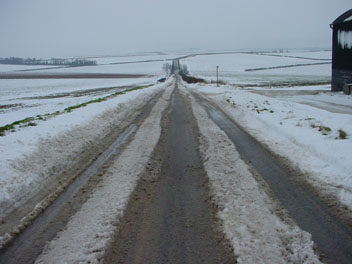
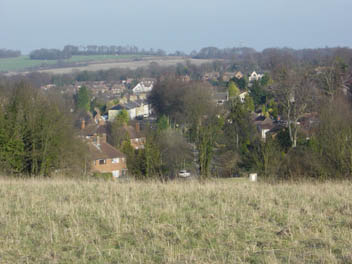
| The B1039 Royston/Saffron Walden road mid-way between Royston and Barley is still snow covered on 1st February 2003 from the snowfall 2 days earlier on 30th January. A thaw has set in and the temperature has risen to 2.1°C when this photograph was taken at 0959 GMT. Patches of snow persisted in this area for several days despite the rapid thaw. A maximum temperature of 5.0°C was achieved for the day and 1.7 hours sunshine was recorded. | This is the town of Royston as viewed from the eastern perimeter of Therfield Heath on 17th February 2003 at 1456 GMT. The town is surrounded by higher ground to the E, S and W but to the N lies the flatter South Cambridgeshire Plain. Hyde Hill to the E of the town can be seen in the distance. It is a sunny afternoon but the temperature is only 3.3°C, whilst a gentle drift of air occasionally gusting to 4 knots is coming in from the E. A sunshine total of 6.2 hours was accumulated for the day. | An array of winter colours as seen in the University Botanic Garden, Cambridge (21 km NE of Royston) on 25th February 2003 at 1143 GMT. Both Royston and Cambridge enjoyed a day of bright but hazy sunshine with an above average maximum temperature of 11.2°C being recorded at Royston after an overnight minimum of 2.5°C. The sunshine total for the day at Royston was 8.3 hours, this being the last day in a 12 day spell in which 82 hours sunshine was recorded (average for whole month 69 h). |
Return to Welcome to Royston (Iceni) Weather Station page
(This page last updated 9th March 2003 1112 GMT)