Royston (Iceni) Weather Station
Daily Weather Observations - August 2004
(All Times GMT)
| Date | Max. Temp. (°C) 09/09h | Min. Temp. (°C) 09/09h | Grass Min. Temp. (°C) 21/09h | Earth (30cms) Temp. (°C) 09h | Sun (Hours) 00/00h | R'fall (MM) 09/09h | Wind Dir'n 09h | Mean Wind Speed (MPH) 00/00h | Max. Gust Speed (MPH) 00/00h | Cloud Cover (Oktas) 09h | Mean MSL Air Pressure (mB) 00/00h | Mean Rel. Humd. (%) 00/00h | Mean Temp. (°C) 00/00h | Fog (vis. <1000m @ 09h) | Fog (vis. <200m @ 09h) | Snow or Rain and Snow 00/00h | Snow Lying @ 09h (>50% cover) | Hail 00/00h | Thunder 00/00h | Date |
| 1 | 25.3 | 14.1 | 11.6 | 20.4 | 9.1 | 0.0 | NE | 0.4 | 14 | 6 | 1020.3 | 76.6 | 19.2 | 0 | 0 | 0 | 0 | 0 | 0 | 1 |
| 2 | 25.9 | 14.4 | 13.6 | 20.6 | 9.1 | 0.1 | NE | 0.8 | 21 | 1 | 1015.8 | 77.2 | 19.4 | 0 | 0 | 0 | 0 | 0 | 0 | 2 |
| 3 | 26.0 | 15.7 | 13.5 | 20.9 | 3.8 | 1.0 | CALM | 0.2 | 16 | 7 | 1010.9 | 78.8 | 20.7 | 0 | 0 | 0 | 0 | 0 | 0 | 3 |
| 4 | 27.6 | 16.1 | 13.6 | 20.7 | 11.1 | 0.0 | N | 0.3 | 12 | 2 | 1011.2 | 73.8 | 21.5 | 0 | 0 | 0 | 0 | 0 | 0 | 4 |
| 5 | 29.0 | 15.4 | 13.3 | 21.1 | 6.2 | 0.0 | E | 0.6 | 23 | 5 | 1012.2 | 71.0 | 21.1 | 0 | 0 | 0 | 0 | 0 | 0 | 5 |
| 6 | 28.4 | 16.7 | 15.9 | 21.3 | 10.7 | 0.0 | W | 1.5 | 16 | 0 | 1013.5 | 70.3 | 22.0 | 0 | 0 | 0 | 0 | 0 | 0 | 6 |
| 7 | 30.5 | 17.0 | 14.5 | 21.4 | 12.5 | 0.0 | W | 1.2 | 21 | 2 | 1011.9 | 67.4 | 22.5 | 0 | 0 | 0 | 0 | 0 | 0 | 7 |
| 8 | 29.5 | 16.9 | 15.1 | 21.5 | 10.6 | 0.1 | SE | 1.6 | 23 | 0 | 1004.9 | 71.1 | 23.4 | 0 | 0 | 0 | 0 | 0 | 0 | 8 |
| 9 | 24.3 | 21.1 | 19.5 | 21.9 | 0.1 | 15.5 | SW | 0.6 | 16 | 8 | 1005.7 | 84.2 | 21.6 | 0 | 0 | 0 | 0 | 0 | 1 | 9 |
| 10 | 23.8 | 18.4 | 17.5 | 21.3 | 4.8 | 0.3 | SE | 0.7 | 12 | 8 | 1007.3 | 84.3 | 20.2 | 0 | 0 | 0 | 0 | 0 | 0 | 10 |
| 11 | 25.0 | 15.9 | 13.4 | 20.6 | 7.4 | 0.9 | SW | 2.1 | 23 | 1 | 1008.1 | 70.7 | 20.0 | 0 | 0 | 0 | 0 | 0 | 0 | 11 |
| 12 | 22.4 | 17.1 | 15.7 | 20.8 | 3.2 | 4.4 | S | 1.3 | 28 | 7 | 1002.9 | 86.5 | 18.6 | 0 | 0 | 0 | 0 | 0 | 1 | 12 |
| 13 | 21.7 | 14.5 | 12.8 | 20.2 | 0.6 | 0.2 | W | 3.4 | 21 | 8 | 1006.2 | 86.4 | 17.2 | 0 | 0 | 0 | 0 | 0 | 0 | 13 |
| 14 | 25.4 | 11.9 | 9.4 | 20.0 | 12.3 | 0.0 | NW | 0.8 | 12 | 3 | 1017.3 | 72.9 | 18.8 | 0 | 0 | 0 | 0 | 0 | 0 | 14 |
| 15 | 24.8 | 14.9 | 13.0 | 20.5 | 4.6 | 0.1 | SW | 2.8 | 16 | 7 | 1015.1 | 78.8 | 19.6 | 0 | 0 | 0 | 0 | 0 | 0 | 15 |
| 16 | 22.6 | 15.4 | 13.6 | 20.6 | 4.0 | 1.4 | W | 3.9 | 25 | 1 | 1005.6 | 84.7 | 18.1 | 0 | 0 | 0 | 0 | 0 | 0 | 16 |
| 17 | 24.2 | 14.7 | 13.2 | 20.2 | 8.9 | 5.1 | SW | 3.8 | 21 | 4 | 1000.8 | 79.1 | 19.1 | 0 | 0 | 0 | 0 | 0 | 0 | 17 |
| 18 | 23.8 | 16.1 | 15.1 | 20.1 | 6.3 | 0.8 | S | 4.7 | 30 | 7 | 996.5 | 83.4 | 18.5 | 0 | 0 | 0 | 0 | 0 | 1 | 18 |
| 19 | 21.9 | 13.8 | 11.5 | 19.6 | 6.7 | 4.1 | SW | 5.7 | 32 | 5 | 999.0 | 83.1 | 17.1 | 0 | 0 | 0 | 0 | 0 | 0 | 19 |
| 20 | 21.0 | 13.5 | 12.0 | 19.0 | 6.3 | 6.1 | SW | 4.1 | 25 | 5 | 1003.9 | 88.3 | 15.6 | 0 | 0 | 0 | 0 | 0 | 1 | 20 |
| 21 | 21.2 | 8.9 | 6.9 | 18.6 | 9.0 | 0.0 | NW | 1.1 | 18 | 1 | 1016.3 | 73.4 | 14.0 | 0 | 0 | 0 | 0 | 0 | 0 | 21 |
| 22 | 21.7 | 11.5 | 9.3 | 18.5 | 9.6 | 7.4 | SW | 1.4 | 18 | 2 | 1018.3 | 65.9 | 16.4 | 0 | 0 | 0 | 0 | 0 | 0 | 22 |
| 23 | 20.3 | 13.8 | 12.8 | 18.9 | 3.7 | 1.7 | SE | 3.3 | 25 | 8 | 1009.4 | 89.7 | 16.5 | 0 | 0 | 0 | 0 | 0 | 1 | 23 |
| 24 | 22.1 | 14.4 | 12.6 | 18.4 | 4.9 | 0.7 | SW | 5.0 | 28 | 7 | 1005.4 | 84.2 | 16.9 | 0 | 0 | 0 | 0 | 0 | 0 | 24 |
| 25 | 20.0 | 13.0 | 10.8 | 18.6 | 6.4 | 0.6 | W | 3.7 | 25 | 5 | 1007.0 | 83.6 | 16.1 | 0 | 0 | 0 | 0 | 0 | 0 | 25 |
| 26 | 22.1 | 13.5 | 11.4 | 18.5 | 5.2 | 5.4 | W | 3.8 | 23 | 6 | 1015.5 | 75.0 | 16.8 | 0 | 0 | 0 | 0 | 0 | 0 | 26 |
| 27 | 20.1 | 13.0 | 12.5 | 18.8 | 2.0 | 0.4 | SW | 4.6 | 30 | 8 | 1008.8 | 82.4 | 16.0 | 0 | 0 | 0 | 0 | 0 | 0 | 27 |
| 28 | 19.1 | 11.0 | 7.9 | 18.3 | 1.8 | 0.3 | W | 1.0 | 16 | 7 | 1011.8 | 71.1 | 14.9 | 0 | 0 | 0 | 0 | 0 | 0 | 28 |
| 29 | 18.3 | 12.0 | 9.0 | 18.0 | 1.7 | 0.1 | SW | 5.2 | 28 | 8 | 1009.5 | 79.5 | 14.6 | 0 | 0 | 0 | 0 | 0 | 0 | 29 |
| 30 | 19.1 | 11.5 | 8.5 | 17.6 | 8.0 | 0.3 | NW | 6.0 | 32 | 5 | 1012.4 | 75.6 | 14.6 | 0 | 0 | 0 | 0 | 0 | 0 | 30 |
| 31 | 20.4 | 9.9 | 6.7 | 17.4 | 7.9 | 0.0 | SW | 1.4 | 18 | 4 | 1018.3 | 75.5 | 13.8 | 0 | 0 | 0 | 0 | 0 | 0 | 31 |
| Total/Mean | 23.5 | 14.4 | 12.5 | 19.8 | 198.3 | 57.0 | X | 2.5 | X | 4.8 | 1009.7 | 78.2 | 18.2 | 0 | 0 | 0 | 0 | 0 | 5 | Total/Mean |
| *Diff./% | +1.2 | +1.8 | 106% | 115% | *Diff./% |
Differences from average:
Differences from average shown in red. Reference periods used are as follows: Temperature 30 Years 1973/2002; rainfall 30 Years 1971/2000; sunshine 30 Years 1971/2000.
(*The differences from average quoted during the course of the month relate to the cumulative daily averages up to the date of the last observation, not the averages for the month as a whole)
Additional Data:
Rainfall Duration 49.2 hours
Air Frost Duration NIL hours
Graphs and Charts:
Click on the following links to view this month's graphs and charts.....
1. Daily Maximum, Minimum & Grass Minimum Temperatures
2. Daily Maximum & Minimum Temperatures (with 30 Year Comparative Means)
3. Daily Earth (30 cms Depth) Temperature @ 0900 GMT 4. Daily Rainfall 5. Daily Sunshine
6. Daily Maximum Gust & Mean Wind Speed 7. Daily Wind Direction @ 0900 GMT
8. Daily Mean MSL Air Pressure 9. Daily Mean Relative Humidity 10. Thermograph
11. Barograph 12. Hygrograph 13. Anemograph 14. Wind Direction
15. Sunshine Duration 16. Rainfall Intensity & Duration
August 2004 Weather Review:
......and click on the link below for a text report of the August 2004 weather in Royston
August (since 1972) at Royston (Iceni) Weather Station:
Mean day maximum temperature (30 years 1973/2002) 22.3°C
Mean night minimum temperature (30 years 1973/2002) 12.6°C
Highest temperature 36.4°C (10th August 2003); lowest temperature 5.1°C (23rd August1993)
Lowest grass minimum temperature 1.0°C (23rd August1993)
Hottest August 1997 (Mean temperature 20.9°C); coolest August 1986 (Mean temperature 14.9°C)
Average August rainfall (30 years 1971/2000) 49.6 mm
Wettest August 1974 (Rainfall 109.0 mm); driest August 2003 (Rainfall 0.7 mm)
Wettest Day 31st August 1988 (Rainfall 45.3 mm);
Highest number of "rain days" (0.2 mm or more) 16 (1974, 1985 & 1992); lowest number of "rain days" 1 (2003)
Highest number of days with thunder 6 (1999)
|
|
|
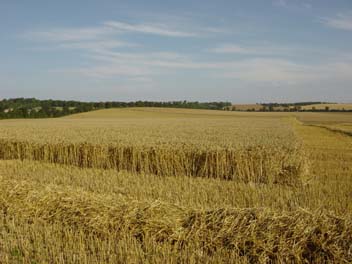
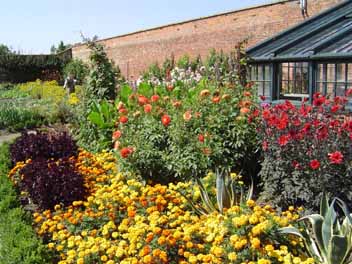
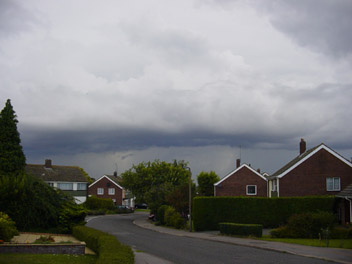
| In this view as seen at Lowerfield some 3 km SE of Royston on 11th August 2004 at 0745 GMT the weather looks ideal for continuing to harvest the cereal crop, a gentle SW breeze drifting across the landscape in an unusually high temperature (for the time of day) of 19.7°C. However, appearances can be deceptive and the harvest has, in fact, stalled due to heavy rainfall the previous day, and further rainfall on most of the succeeding days resulted in this particular crop still standing as photographed over 2 weeks later. It remained mostly sunny on this day until mid-afternoon and the sunshine total for the day was 7.4 hours. The maximum temperature was 25.0°C. | A dazzling array of flowers and vegetables greets visitors to the Working Walled Kitchen Garden on the Wimpole Estate, some 10 km N of Royston. The Kitchen Garden is part of 60 acres of gardens including a formal garden with a parterre and informal pleasure grounds with daffodils and rare and unusual trees. The glasshouses seen on the right of the picture have been restored in recent years. The main pedestrian route to Home Farm, which is the largest rare breeds centre in East Anglia, now passes through the Garden so visitors can enjoy its many attributes on the way to view the animals. This view was photographed at 1247 GMT on 14th August 2004. | This menacing looking storm with visible lightning approached Royston slowly during the afternoon of 20th August 2004 from a NW direction, although radar images showed the main thrust of the line of storm cells was from SW to NE with only erratic movement of the line towards the SE. Consequently, when the storm had almost reached an overhead position it slid away to the NE and gave only minimal rainfall at Royston (Iceni) Weather Station on the E perimeter of the town. The storm as seen in this photograph was viewed from Poplar Drive, Royston at 1536 GMT. Other showers that day boosted the daily rainfall total day to 6.1 millimetres. |
Return to Welcome to Royston (Iceni) Weather Station page
(This page last updated 17th September 2004 2006 GMT)