
Royston (Iceni) Weather Station
Daily Weather Observations - August 2006
(All Times GMT)
| Date | Max. Temp. (°C) 09/09h | Min. Temp. (°C) 09/09h | Grass Min. Temp. (°C) 21/09h | Earth (30cms) Temp. (°C) 09h | Sun (Hours) 00/00h | R'fall (MM) 09/09h | Wind Dir'n 09h | Mean Wind Speed (MPH) 00/00h | Max. Gust Speed (MPH) 00/00h | Cloud Cover (Oktas) 09h | Mean MSL Air Pressure (mB) 00/00h | Mean Rel. Humd. (%) 00/00h | Mean Temp. (°C) 00/00h | Fog (vis. <1000m @ 09h) | Fog (vis. <200m @ 09h) | Snow or Rain and Snow 00/00h | Snow Lying @ 09h (>50% cover) | Hail 00/00h | Thunder 00/00h | Date |
| 1 | 21.5 | 13.6 | 12.5 | 21.0 | 5.1 | 0.1 | W | 6.7 | 37 | 5 | 1003.4 | 74.5 | 17.4 | 0 | 0 | 0 | 0 | 0 | 0 | 1 |
| 2 | 19.6 | 13.5 | 11.7 | 20.3 | 1.2 | 2.7 | W | 7.1 | 32 | 8 | 1005.0 | 78.6 | 15.6 | 0 | 0 | 0 | 0 | 0 | 0 | 2 |
| 3 | 18.0 | 13.7 | 13.7 | 19.6 | 2.7 | 0.0 | NW | 3.5 | 30 | 8 | 1010.5 | 87.2 | 15.4 | 0 | 0 | 0 | 0 | 0 | 0 | 3 |
| 4 | 20.9 | 10.6 | 8.2 | 18.5 | 2.1 | 0.0 | N | X | X | 8 | 1017.5 | 71.3 | 15.8 | 0 | 0 | 0 | 0 | 0 | 0 | 4 |
| 5 | 27.1 | 11.0 | 8.5 | 18.5 | 11.8 | 0.0 | N | 0.2 | 12 | 1 | 1019.2 | 67.6 | 19.2 | 0 | 0 | 0 | 0 | 0 | 0 | 5 |
| 6 | 27.3 | 16.6 | 14.7 | 19.8 | 5.9 | 5.9 | NW | 0.2 | 12 | 1 | 1018.7 | 67.9 | 22.4 | 0 | 0 | 0 | 0 | 0 | 0 | 6 |
| 7 | 23.9 | 17.3 | 16.2 | 20.5 | 3.9 | 0.0 | N | 1.1 | 23 | 8 | 1019.7 | 84.1 | 18.3 | 0 | 0 | 0 | 0 | 0 | 0 | 7 |
| 8 | 24.3 | 9.8 | 7.0 | 19.5 | 9.8 | 0.1 | N | 0.6 | 23 | 1 | 1019.5 | 66.5 | 18.0 | 0 | 0 | 0 | 0 | 0 | 0 | 8 |
| 9 | 21.9 | 15.0 | 14.7 | 20.0 | 6.3 | 0.0 | NW | 3.0 | 30 | 2 | 1014.8 | 65.2 | 17.5 | 0 | 0 | 0 | 0 | 0 | 0 | 9 |
| 10 | 21.0 | 11.5 | 9.6 | 19.8 | 4.8 | 0.0 | W | 5.4 | 35 | 8 | 1012.9 | 67.9 | 15.7 | 0 | 0 | 0 | 0 | 0 | 0 | 10 |
| 11 | 19.3 | 10.3 | 8.0 | 19.1 | 3.5 | 2.2 | NW | 2.2 | 23 | 6 | 1010.7 | 74.6 | 14.7 | 0 | 0 | 0 | 0 | 0 | 0 | 11 |
| 12 | 15.9 | 13.0 | 12.0 | 18.6 | 0.0 | 10.4 | NW | 4.8 | 35 | 8 | 1010.2 | 91.2 | 13.8 | 0 | 0 | 0 | 0 | 0 | 0 | 12 |
| 13 | 21.8 | 12.1 | 11.5 | 17.9 | 5.4 | 2.4 | N | 2.6 | 28 | 7 | 1007.2 | 88.6 | 15.6 | 0 | 0 | 0 | 0 | 0 | 0 | 13 |
| 14 | 16.3 | 13.0 | 11.4 | 18.4 | 1.4 | 0.1 | NW | 0.8 | 18 | 8 | 1009.1 | 94.0 | 14.1 | 0 | 0 | 0 | 0 | 0 | 0 | 14 |
| 15 | 21.0 | 12.2 | 10.1 | 17.6 | 2.4 | 0.0 | W | 1.5 | 18 | 8 | 1004.8 | 75.9 | 16.1 | 0 | 0 | 0 | 0 | 0 | 0 | 15 |
| 16 | 21.9 | 11.9 | 10.6 | 18.0 | 6.0 | 2.5 | S | 0.5 | 23 | 2 | 1000.6 | 82.7 | 16.2 | 0 | 0 | 0 | 0 | 0 | 0 | 16 |
| 17 | 21.0 | 13.4 | 10.5 | 18.0 | 3.9 | 7.0 | S | 0.5 | 25 | 7 | 998.6 | 83.5 | 16.6 | 0 | 0 | 0 | 0 | 1 | 1 | 17 |
| 18 | 20.6 | 14.1 | 12.0 | 18.0 | 2.9 | 15.6 | NE | 1.4 | 21 | 6 | 999.6 | 92.7 | 16.3 | 0 | 0 | 0 | 0 | 0 | 1 | 18 |
| 19 | 21.0 | 14.0 | 12.5 | 18.0 | 5.3 | 9.9 | SW | 2.7 | 23 | 2 | 1006.0 | 90.8 | 16.3 | 0 | 0 | 0 | 0 | 0 | 1 | 19 |
| 20 | 21.9 | 14.5 | 13.7 | 18.0 | 3.1 | 6.6 | W | 4.8 | 25 | 7 | 1011.5 | 85.3 | 17.1 | 0 | 0 | 0 | 0 | 0 | 0 | 20 |
| 21 | 20.0 | 13.1 | 11.0 | 18.3 | 4.6 | 2.4 | S | 2.1 | 23 | 8 | 1014.1 | 85.3 | 16.0 | 0 | 0 | 0 | 0 | 0 | 1 | 21 |
| 22 | 21.4 | 11.2 | 9.8 | 18.0 | 7.9 | 0.0 | W | 0.9 | 16 | 2 | 1016.2 | 75.4 | 16.2 | 0 | 0 | 0 | 0 | 0 | 0 | 22 |
| 23 | 19.6 | 13.9 | 12.3 | 18.2 | 0.5 | 10.0 | SW | 1.8 | 21 | 7 | 1009.9 | 89.6 | 16.4 | 0 | 0 | 0 | 0 | 0 | 0 | 23 |
| 24 | 18.6 | 14.0 | 14.0 | 18.0 | 0.8 | 0.0 | NW | 0.9 | 18 | 8 | 1005.9 | 87.5 | 15.3 | 0 | 0 | 0 | 0 | 0 | 0 | 24 |
| 25 | 21.5 | 9.1 | 6.5 | 17.4 | 8.0 | 6.1 | W | 0.2 | 12 | 1 | 1006.8 | 74.8 | 15.5 | 0 | 0 | 0 | 0 | 0 | 0 | 25 |
| 26 | 18.8 | 13.5 | 12.8 | 17.9 | 1.2 | 0.0 | NW | 0.5 | 14 | 8 | 1006.8 | 90.3 | 15.9 | 0 | 0 | 0 | 0 | 0 | 0 | 26 |
| 27 | 20.9 | 12.9 | 11.3 | 17.7 | 6.6 | 2.0 | W | 2.6 | 28 | 3 | 1010.6 | 73.8 | 16.5 | 0 | 0 | 0 | 0 | 0 | 0 | 27 |
| 28 | 19.2 | 13.0 | 12.0 | 17.8 | 10.3 | TR | W | 5.5 | 35 | 3 | 1006.2 | 75.1 | 15.3 | 0 | 0 | 0 | 0 | 0 | 0 | 28 |
| 29 | 20.1 | 11.0 | 9.1 | 17.6 | 9.0 | 3.6 | W | 4.1 | 35 | 1 | 1007.3 | 78.4 | 13.9 | 0 | 0 | 0 | 0 | 0 | 1 | 29 |
| 30 | 20.7 | 10.3 | 8.5 | 17.4 | 10.1 | 0.9 | W | 2.9 | 23 | 2 | 1017.1 | 73.0 | 15.1 | 0 | 0 | 0 | 0 | 0 | 0 | 30 |
| 31 | 22.7 | 12.7 | 12.3 | 17.6 | 0.9 | 0.9 | SW | 4.1 | 30 | 8 | 1017.0 | 81.7 | 18.5 | 0 | 0 | 0 | 0 | 0 | 0 | 31 |
| Total/Mean | 21.0 | 12.8 | 11.2 | 18.5 | 147.4 | 91.4 | X | 2.5 | X | 5.2 | 1010.2 | 79.8 | 16.3 | 0 | 0 | 0 | 0 | 1 | 5 | Total/Mean |
| *Diff./% | -1.4 | +0.1 | 79% | 184% | *Diff./% | |||||||||||||||
| Date | Max. Temp. (°C) 09/09h | Min. Temp. (°C) 09/09h | Grass Min. Temp. (°C) 21/09h | Earth (30cms) Temp. (°C) 09h | Sun (Hours) 00/00h | R'fall (MM) 09/09h | Wind Dir'n 09h | Mean Wind Speed (MPH) 00/00h | Max. Gust Speed (MPH) 00/00h | Cloud Cover (Oktas) 09h | Mean MSL Air Pressure (mB) 00/00h | Mean Rel. Humd. (%) 00/00h | Mean Temp. (°C) 00/00h | Fog (vis. <1000m @ 09h) | Fog (vis. <200m @ 09h) | Snow or Rain and Snow 00/00h | Snow Lying @ 09h (>50% cover) | Hail 00/00h | Thunder 00/00h | Date |
Differences from average:
Differences from average shown in red. Reference periods used are as follows: Temperature 30 Years 1976/2005; rainfall 30 Years 1971/2000; sunshine 30 Years 1971/2000.
(*The differences from average quoted during the course of the month relate to the cumulative daily averages up to the date of the last observation, not the averages for the month as a whole)
Additional Data:
Rainfall Duration 48.0 hours
Air Frost Duration NIL hours
Graphs and Charts:
Click on the following links to view this month's graphs and charts.....
1. Daily Maximum, Minimum & Grass Minimum Temperatures
2. Daily Maximum & Minimum Temperatures (with 30 Year Comparative Means)
3. Daily Earth (30 cms Depth) Temperature @ 0900 GMT 4. Daily Rainfall 5. Daily Sunshine
6. Daily Maximum Gust & Mean Wind Speed 7. Daily Wind Direction @ 0900 GMT
8. Daily Mean MSL Air Pressure 9. Daily Mean Relative Humidity 10. Thermograph
11. Barograph 12. Hygrograph 13. Anemograph 14. Wind Direction
15. Sunshine Duration 16. Rainfall Intensity & Duration
August 2006 Weather Review:
......and click on the link below for a text report of the August 2006 weather in Royston
August (since 1972) at Royston (Iceni) Weather Station:
Mean day maximum temperature (30 years 1976/2005) 22.4°C
Mean night minimum temperature (30 years 1976/2005) 12.7°C
Highest temperature 36.4°C (10th August 2003); lowest temperature 5.1°C (23rd August1993)
Lowest grass minimum temperature 1.0°C (23rd August1993)
Hottest August 1997 (Mean temperature 20.9°C); coolest August 1986 (Mean temperature 14.9°C)
Average August rainfall (30 years 1971/2000) 49.6 mm
Wettest August 1974 (Rainfall 109.0 mm); driest August 2003 (Rainfall 0.7 mm)
Wettest Day 31st August 1988 (Rainfall 45.3 mm);
Highest number of "rain days" (0.2 mm or more) 19 (2004); lowest number of "rain days" 1 (2003)
Highest number of days with thunder 6 (1999)
|
|
|
|
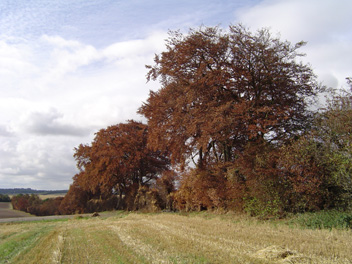
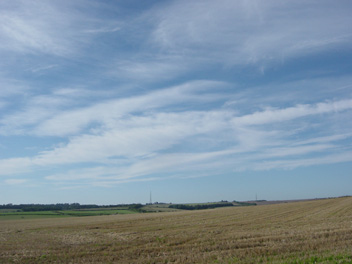
| This picture taken at 1352 GMT on 5th August 2006 shows a part of the magnificent parterre at Wimpole Hall (10 km N of Royston). The view is from just outside the hall looking northwards across the parterre into the park and towards the lake and Folly, the latter being obscured by the large trees in the middle distance. The parterre extends to both the left and right of this photograph. It is a gorgeous summer day with a light north-westerly air with gusts to 6 knots, and a temperature of 26°C. The maximum temperature at Royston that day was 27.1°C, after an overnight minimum of 11.0°C, whilst the sunshine total was 11.8 hours. | The scene depicted in this photograph may look autumnal but the date is actually 11th August 2006 (at 0810 GMT). This boundary of trees and bushes between Burloes and Lowerfield E of Royston was a victim of a harvest fire on the hottest day of the year, 19th July, and has been badly scorched by the flames which destroyed some 40 acres of standing oilseed rape and barley crops. This view (looking southwards) is of the same belt of trees featured last month but in the reverse direction and shows that the burnt leaves have turned a much darker brown. Sunshine on this day was disappointing at 3.5 hours, as was the maximum temperature of 19.3°C. | After the hot and sunny months of June and July 2006 the month of August was rather cool and unsettled with rainfall well in excess of normal. However, on 30th August a ridge of high pressure crossing the country gave this fine display of early morning cirrus cloud over Royston (as viewed from close to the B1039 Royston to Barley road looking southwards) and this heralded a dry day with sunny spells and variable cloud ahead of a rain bearing warm front being propelled eastwards by a low in mid-Atlantic. The temperature at the time of the photograph (0801 GMT) was 14.5°C, whilst the sunshine total for the day was 10.1 hours. |
Return to Welcome to Royston (Iceni) Weather Station page
(This page last updated 8th September 2006 2001 GMT)