Royston (Iceni) Weather Station
Daily Weather Observations - December 2006
(All Times GMT)
| Date | Max. Temp. (°C) 09/09h | Min. Temp. (°C) 09/09h | Grass Min. Temp. (°C) 21/09h | Earth (30cms) Temp. (°C) 09h | Sun (Hours) 00/00h | R'fall (MM) 09/09h | Wind Dir'n 09h | Mean Wind Speed (MPH) 00/00h | Max. Gust Speed (MPH) 00/00h | Cloud Cover (Oktas) 09h | Mean MSL Air Pressure (mB) 00/00h | Mean Rel. Humd. (%) 00/00h | Mean Temp. (°C) 00/00h | Fog (vis. <1000m @ 09h) | Fog (vis. <200m @ 09h) | Snow or Rain and Snow 00/00h | Snow Lying @ 09h (>50% cover) | Hail 00/00h | Thunder 00/00h | Date |
| 1 | 13.1 | 7.4 | 6.5 | 8.5 | 0.0 | 2.0 | S | 6.8 | 35 | 8 | 1012.2 | 96.3 | 10.7 | 0 | 0 | 0 | 0 | 0 | 0 | 1 |
| 2 | 10.5 | 9.1 | 8.0 | 9.3 | 2.9 | 4.7 | S | 3.1 | 25 | 8 | 1006.9 | 91.6 | 9.3 | 0 | 0 | 0 | 0 | 0 | 0 | 2 |
| 3 | 10.1 | 7.5 | 5.4 | 9.0 | 4.9 | 0.8 | S | 12.0 | 53 | 8 | 990.5 | 83.1 | 8.5 | 0 | 0 | 0 | 0 | 0 | 0 | 3 |
| 4 | 14.3 | 6.4 | 4.5 | 8.4 | 4.5 | 0.1 | SW | 8.9 | 39 | 0 | 992.3 | 88.5 | 9.8 | 0 | 0 | 0 | 0 | 0 | 0 | 4 |
| 5 | 13.8 | 13.0 | 11.4 | 8.9 | 1.5 | 1.3 | SW | 12.4 | 44 | 6 | 987.5 | 82.7 | 11.7 | 0 | 0 | 0 | 0 | 0 | 0 | 5 |
| 6 | 11.1 | 8.3 | 6.4 | 8.9 | 4.8 | 5.3 | SW | 8.7 | 35 | 5 | 997.1 | 82.1 | 8.1 | 0 | 0 | 0 | 0 | 0 | 0 | 6 |
| 7 | 10.0 | 5.9 | 4.0 | 8.5 | 2.9 | 0.4 | SW | 12.7 | 48 | 4 | 985.4 | 82.3 | 9.1 | 0 | 0 | 0 | 0 | 0 | 0 | 7 |
| 8 | 8.1 | 7.0 | 5.9 | 8.3 | 0.0 | 0.0 | S | 3.9 | 32 | 8 | 985.8 | 86.0 | 6.7 | 0 | 0 | 0 | 0 | 0 | 0 | 8 |
| 9 | 7.9 | 2.5 | -0.7 | 7.7 | 6.3 | 0.0 | W | 2.7 | 18 | 0 | 1009.4 | 90.3 | 3.9 | 0 | 0 | 0 | 0 | 0 | 0 | 9 |
| 10 | 12.5 | 0.5 | -1.0 | 6.6 | 2.4 | 4.3 | S | 7.2 | 44 | 2 | 1019.1 | 91.2 | 5.5 | 0 | 0 | 0 | 0 | 0 | 0 | 10 |
| 11 | 12.2 | 9.5 | 8.8 | 7.4 | 0.0 | 4.6 | SW | 8.0 | 41 | 8 | 1009.8 | 92.5 | 9.1 | 0 | 0 | 0 | 0 | 0 | 0 | 11 |
| 12 | 10.8 | 3.1 | 1.4 | 7.5 | 3.3 | 0.4 | SW | 8.4 | 39 | 5 | 1014.9 | 89.6 | 7.1 | 0 | 0 | 0 | 0 | 0 | 0 | 12 |
| 13 | 12.0 | 9.5 | 7.5 | 7.5 | 0.0 | 0.0 | SW | 8.7 | 35 | 8 | 1017.5 | 86.6 | 10.8 | 0 | 0 | 0 | 0 | 0 | 0 | 13 |
| 14 | 12.7 | 11.0 | 9.7 | 8.2 | 0.2 | 0.0 | SW | 10.5 | 35 | 8 | 1017.9 | 84.6 | 11.7 | 0 | 0 | 0 | 0 | 0 | 0 | 14 |
| 15 | 11.6 | 10.0 | 7.9 | 8.7 | 0.0 | 9.8 | SW | 7.5 | 30 | 7 | 1015.7 | 85.9 | 10.8 | 0 | 0 | 0 | 0 | 0 | 0 | 15 |
| 16 | 7.0 | 3.7 | 1.9 | 8.8 | 5.9 | 0.0 | W | 2.8 | 21 | 2 | 1019.0 | 96.2 | 4.7 | 0 | 0 | 0 | 0 | 0 | 0 | 16 |
| 17 | 7.8 | 3.6 | 1.5 | 7.5 | 6.5 | 0.0 | SW | 2.7 | 21 | 0 | 1023.7 | 91.7 | 5.1 | 0 | 0 | 0 | 0 | 0 | 0 | 17 |
| 18 | 6.8 | 2.5 | -1.2 | 6.9 | 4.6 | 0.0 | S | 0.5 | 12 | 8 | 1027.1 | 97.1 | 3.3 | 0 | 0 | 0 | 0 | 0 | 0 | 18 |
| 19 | 1.3 | -4.0 | -7.1 | 6.0 | 3.7 | 0.0 | CALM | 0.0 | 2 | 2 | 1035.8 | 98.8 | -1.3 | 0 | 0 | 0 | 0 | 0 | 0 | 19 |
| 20 | 2.7 | -2.4 | -6.5 | 5.3 | 5.6 | 0.2 | CALM | 0.1 | 9 | 0 | 1038.1 | 98.2 | -0.4 | 0 | 0 | 0 | 0 | 0 | 0 | 20 |
| 21 | 1.6 | -1.0 | -1.0 | 4.7 | 0.0 | 0.2 | W | 0.0 | 6 | 8 | 1041.0 | 99.9 | 0.4 | 1 | 1 | 0 | 0 | 0 | 0 | 21 |
| 22 | 1.2 | -1.1 | -1.0 | 5.0 | 0.0 | 0.2 | CALM | 0.0 | 2 | 8 | 1041.6 | 100.0 | -0.7 | 1 | 1 | 0 | 0 | 0 | 0 | 22 |
| 23 | 5.0 | -0.6 | -0.4 | 5.1 | 0.0 | 0.0 | N | 0.0 | 7 | 8 | 1040.1 | 100.0 | 1.7 | 0 | 1 | 0 | 0 | 0 | 0 | 23 |
| 24 | 6.3 | 3.3 | 3.3 | 5.5 | 0.0 | 0.0 | NE | 0.1 | 14 | 8 | 1037.0 | 95.5 | 5.0 | 0 | 0 | 0 | 0 | 0 | 0 | 24 |
| 25 | 5.9 | 5.0 | 4.5 | 6.0 | 0.0 | 0.0 | E | 0.0 | 9 | 8 | 1035.1 | 90.9 | 5.2 | 0 | 0 | 0 | 0 | 0 | 0 | 25 |
| 26 | 5.9 | 4.3 | 3.9 | 6.2 | 0.0 | 0.2 | CALM | 0.0 | 5 | 8 | 1031.9 | 95.4 | 4.9 | 0 | 0 | 0 | 0 | 0 | 0 | 26 |
| 27 | 10.1 | 3.0 | 2.7 | 6.4 | 0.1 | 1.1 | S | 1.9 | 30 | 8 | 1026.5 | 95.0 | 4.1 | 0 | 0 | 0 | 0 | 0 | 0 | 27 |
| 28 | 11.2 | 5.6 | 5.5 | 6.5 | 3.9 | 0.0 | SW | 3.7 | 25 | 8 | 1021.7 | 96.0 | 8.7 | 0 | 0 | 0 | 0 | 0 | 0 | 28 |
| 29 | 13.0 | 3.0 | 1.7 | 6.6 | 0.0 | 12.2 | S | 9.3 | 44 | 8 | 1010.6 | 96.0 | 7.5 | 0 | 0 | 0 | 0 | 0 | 0 | 29 |
| 30 | 12.0 | 10.0 | 8.0 | 7.3 | 3.5 | 17.9 | SW | 10.9 | 65 | 0 | 1002.6 | 89.9 | 10.3 | 0 | 0 | 0 | 0 | 0 | 0 | 30 |
| 31 | 12.0 | 6.6 | 4.6 | 7.5 | 0.1 | 5.0 | S | 9.8 | 44 | 7 | 1011.1 | 90.2 | 9.0 | 0 | 0 | 0 | 0 | 0 | 0 | 31 |
| Total/Mean | 9.0 | 4.9 | 3.4 | 7.2 | 67.4 | 70.7 | X | 5.3 | X | 5.7 | 1016.3 | 91.7 | 6.5 | 3 | 2 | 0 | 0 | 0 | 0 | Total/Mean |
| *Diff./% | +1.9 | +1.9 | 141% | 134% | *Diff./% | |||||||||||||||
| Date | Max. Temp. (°C) 09/09h | Min. Temp. (°C) 09/09h | Grass Min. Temp. (°C) 21/09h | Earth (30cms) Temp. (°C) 09h | Sun (Hours) 00/00h | R'fall (MM) 09/09h | Wind Dir'n 09h | Mean Wind Speed (MPH) 00/00h | Max. Gust Speed (MPH) 00/00h | Cloud Cover (Oktas) 09h | Mean MSL Air Pressure (mB) 00/00h | Mean Rel. Humd. (%) 00/00h | Mean Temp. (°C) 00/00h | Fog (vis. <1000m @ 09h) | Fog (vis. <200m @ 09h) | Snow or Rain and Snow 00/00h | Snow Lying @ 09h (>50% cover) | Hail 00/00h | Thunder 00/00h | Date |
Differences from average:
Differences from average shown in red. Reference periods used are as follows: Temperature 30 Years 1976/2005; rainfall 30 Years 1971/2000; sunshine 30 Years 1971/2000.
(*The differences from average quoted during the course of the month relate to the cumulative daily averages up to the date of the last observation, not the averages for the month as a whole)
Additional Data:
Rainfall Duration 31.0 hours
Air Frost Duration 63.6 hours
Graphs and Charts:
Click on the following links to view this month's graphs and charts.....
1. Daily Maximum, Minimum & Grass Minimum Temperatures
2. Daily Maximum & Minimum Temperatures (with 30 Year Comparative Means)
3. Daily Earth (30 cms Depth) Temperature @ 0900 GMT 4. Daily Rainfall 5. Daily Sunshine
6. Daily Maximum Gust & Mean Wind Speed 7. Daily Wind Direction @ 0900 GMT
8. Daily Mean MSL Air Pressure 9. Daily Mean Relative Humidity 10. Thermograph
11. Barograph 12. Hygrograph 13. Anemograph 14. Wind Direction
15. Sunshine Duration 16. Rainfall Intensity & Duration
December 2006 Weather Review:
......and click on the link below for a text report of the December 2006 weather in Royston
December (since 1972) at Royston (Iceni) Weather Station:
Mean day maximum temperature (30 years 1976/2005) 7.1°C
Mean night minimum temperature (30 years 1976/2005) 3.0°C
Highest temperature 15.1°C (2nd December 1985); lowest temperature -9.8°C (29th December 1995)
Lowest grass minimum temperature -14.6°C (13th December 1981)
Warmest December 1974 (Mean temperature 7.8°C); coldest December 1981 (Mean temperature 0.4°C)
Average December rainfall (30 years 1971/2000) 52.8 mm
Wettest December 1989 (Rainfall 122.4 mm); driest December 1991 (Rainfall 10.3 mm)
Wettest Day 27th December 1979 (Rainfall 31.5 mm);
Highest number of "rain days" (0.2 mm or more) 22 (1978); lowest number of "rain days" 7 (2004)
Highest number of days with thunder 3 (1989)
Highest number of air frosts 20 (1981)
Highest number of ground frosts 25 (1981)
Highest number of days with snow falling 10 (1981)
Highest number of days with snow lying (ground with more than 50% snow cover @ 0900 GMT) 23 (1981)
|
|
|
|
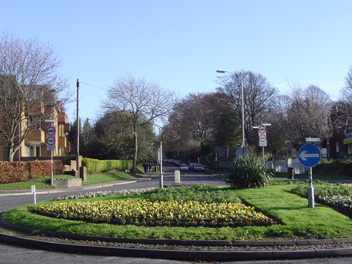
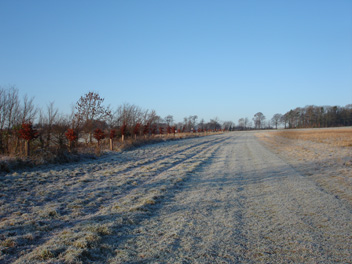
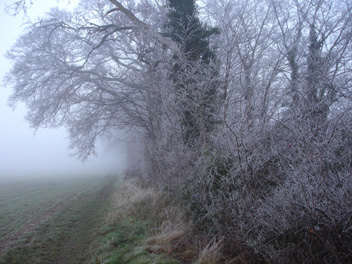
| This view of the Town Hall roundabout in Royston is from outside the Town Hall itself looking eastwards along the Newmarket Road (at 1137 GMT on 4th December 2006). Once again winter flowers (pansies) provide a welcome dash of colour to this part of the town in the otherwise dormant season. Sunshine had been continuous since 0845 GMT but ended abruptly for the day at 1305 GMT. A SW wind of 7 knots gusting to 16 knots is being drawn across the town by a large area of low pressure in the North Atlantic with separate deep centres in mid-Atlantic and off both Cape Farewell and southern Norway. The temperature is 9.7°C (but rising to a very mild 14.3°C by late evening!). | This frosty scene as viewed at 0925 GMT on 20th December 2006 is in a meadow adjacent to the B1039 Royston to Barley Road about 2 km SE of Royston. The grass has been eaten short by sheep which were temporarily folded over in an enclosed part of the meadow, and which have only recently departed. The temperature is -1.5°C at this time in a flat calm. The air did not stir for another 1 hour when a wind gust of 6 knots occurred. This was the last day of sunshine (5.6 hours) before a remarkable 7 day cloudy spell which saw sunshine of only 3 minutes (and this at 1515 GMT on the 7th day!). The maximum temperature this day was 4.0°C below the 30 Year average at 2.7°C. | The first 3 days of the dull spell referred to in the previous caption were characterised by lingering fog and in this picture taken at 0947 GMT on 22nd December 2006 near to Eagle Tavern, Royston the low temperature and saturated air (relative humidity 100%) have combined to produce this hoar frost on the trees and hedges. Fog deposition in the rain gauge at Royston (Iceni) Weather Station gave a rainfall equivalent of 0.2 millimetres, which effectively made 22nd an official "rain day"! The day was one of unusual continuous calm with a mean wind speed (to nearest 1 decimal place) of 0.0 mph and maximum wind gust speed of only 2 knots. The maximum temperature achieved on 22nd was 1.2°C. |
Return to Welcome to Royston (Iceni) Weather Station page
(This page last updated 13th January 2007 2101 GMT)