Royston (Iceni) Weather Station
Daily Weather Observations - January 2008
(All Times GMT)
| Date | Max. Temp. (°C) 09/09h | Min. Temp. (°C) 09/09h | Grass Min. Temp. (°C) 21/09h | Earth (30cms) Temp. (°C) 09h | Sun (Hours) 00/00h | R'fall (MM) 09/09h | Wind Dir'n 09h | Mean Wind Speed (MPH) 00/00h | Max. Gust Speed (MPH) 00/00h | Cloud Cover (Oktas) 09h | Mean MSL Air Pressure (mB) 00/00h | Mean Rel. Humd. (%) 00/00h | Mean Temp. (°C) 00/00h | Fog (vis. <1000m @ 09h) | Fog (vis. <200m @ 09h) | Snow or Rain and Snow 00/00h | Snow Lying @ 09h (>50% cover) | Hail 00/00h | Thunder 00/00h | Date |
| 1 | 8.5 | 6.0 | 3.9 | 6.4 | 0.3 | 0.2 | S | 2.4 | 14 | 8 | 1020.1 | 98.8 | 6.9 | 1 | 0 | 0 | 0 | 0 | 0 | 1 |
| 2 | 4.3 | 3.7 | 3.2 | 6.7 | 0.9 | 0.0 | SE | 3.8 | 25 | 8 | 1013.2 | 90.1 | 3.1 | 0 | 0 | 0 | 0 | 0 | 0 | 2 |
| 3 | 3.9 | 0.4 | -0.7 | 6.0 | 0.0 | 0.2 | E | 2.9 | 23 | 8 | 1001.3 | 88.9 | 1.2 | 0 | 0 | 1 | 0 | 0 | 0 | 3 |
| 4 | 8.0 | 2.1 | 2.0 | 5.7 | 0.0 | 6.0 | S | 5.0 | 35 | 8 | 996.7 | 99.5 | 5.1 | 0 | 0 | 0 | 0 | 0 | 0 | 4 |
| 5 | 8.3 | 4.9 | 3.0 | 6.0 | 5.0 | 0.0 | SW | 9.0 | 32 | 2 | 994.1 | 89.3 | 5.8 | 0 | 0 | 0 | 0 | 0 | 0 | 5 |
| 6 | 8.5 | 2.8 | 0.4 | 5.6 | 6.2 | 0.2 | SW | 7.6 | 32 | 0 | 1004.4 | 90.1 | 4.6 | 0 | 0 | 0 | 0 | 0 | 0 | 6 |
| 7 | 8.4 | 6.0 | 4.1 | 5.4 | 4.0 | 0.2 | W | 14.1 | 51 | 5 | 1005.0 | 78.5 | 6.4 | 0 | 0 | 0 | 0 | 0 | 0 | 7 |
| 8 | 10.2 | 3.7 | 1.7 | 5.3 | 0.8 | 1.6 | S | 10.4 | 41 | 6 | 1007.7 | 90.8 | 7.4 | 0 | 0 | 0 | 0 | 0 | 0 | 8 |
| 9 | 9.5 | 4.4 | 2.6 | 5.6 | 4.4 | 0.0 | SW | 10.5 | 35 | 7 | 1004.6 | 85.8 | 5.6 | 0 | 0 | 0 | 0 | 0 | 0 | 9 |
| 10 | 10.8 | 6.1 | 4.6 | 5.5 | 0.0 | 1.7 | SW | 11.3 | 44 | 7 | 998.1 | 90.1 | 9.0 | 0 | 0 | 0 | 0 | 0 | 0 | 10 |
| 11 | 9.0 | 5.5 | 3.8 | 6.0 | 0.2 | 13.3 | E | 3.9 | 35 | 8 | 989.3 | 98.1 | 6.6 | 0 | 0 | 0 | 0 | 0 | 0 | 11 |
| 12 | 10.0 | 1.5 | -0.6 | 6.0 | 6.5 | 0.3 | SW | 7.8 | 32 | 0 | 1002.1 | 93.9 | 4.2 | 0 | 0 | 0 | 0 | 0 | 0 | 12 |
| 13 | 10.8 | 5.9 | 5.2 | 5.7 | 0.7 | 1.9 | S | 10.9 | 41 | 8 | 999.6 | 90.3 | 9.0 | 0 | 0 | 0 | 0 | 0 | 0 | 13 |
| 14 | 10.0 | 6.8 | 5.0 | 6.3 | 2.7 | 4.0 | SW | 11.4 | 39 | 8 | 992.0 | 89.2 | 7.9 | 0 | 0 | 0 | 0 | 0 | 0 | 14 |
| 15 | 11.3 | 6.5 | 4.6 | 6.5 | 0.1 | 7.0 | S | 11.7 | 44 | 8 | 979.3 | 97.4 | 8.7 | 0 | 0 | 0 | 0 | 0 | 0 | 15 |
| 16 | 7.8 | 3.9 | 1.6 | 6.7 | 6.9 | TR | SW | 5.7 | 35 | 1 | 989.9 | 91.5 | 4.8 | 0 | 0 | 0 | 0 | 0 | 0 | 16 |
| 17 | 10.8 | 2.0 | -2.0 | 6.0 | 0.4 | 3.5 | S | 10.1 | 76 | 8 | 996.6 | 94.3 | 6.0 | 0 | 0 | 0 | 0 | 0 | 0 | 17 |
| 18 | 13.9 | 6.5 | 4.9 | 6.0 | 0.0 | 2.5 | SW | 13.3 | 46 | 8 | 1005.2 | 92.2 | 10.2 | 0 | 0 | 0 | 0 | 0 | 0 | 18 |
| 19 | 13.0 | 12.1 | 11.5 | 6.9 | 0.0 | 9.6 | W | 8.8 | 41 | 8 | 1013.8 | 98.4 | 11.6 | 0 | 0 | 0 | 0 | 0 | 0 | 19 |
| 20 | 14.1 | 12.1 | 11.3 | 7.8 | 0.0 | TR | W | 14.0 | 44 | 8 | 1015.5 | 92.9 | 12.8 | 0 | 0 | 0 | 0 | 0 | 0 | 20 |
| 21 | 11.4 | 10.9 | 10.0 | 8.4 | 0.7 | 0.5 | SW | 14.9 | 44 | 8 | 1006.5 | 88.1 | 10.3 | 0 | 0 | 0 | 0 | 0 | 0 | 21 |
| 22 | 10.0 | 1.1 | -2.0 | 8.1 | 3.8 | 0.5 | W | 5.9 | 30 | 3 | 1020.8 | 88.4 | 4.5 | 0 | 0 | 0 | 0 | 0 | 0 | 22 |
| 23 | 12.3 | 6.2 | 5.5 | 7.5 | 0.1 | 0.0 | SW | 10.1 | 35 | 8 | 1020.3 | 93.1 | 10.2 | 0 | 0 | 0 | 0 | 0 | 0 | 23 |
| 24 | 10.4 | 10.0 | 8.4 | 7.9 | 4.5 | 0.0 | W | 9.8 | 37 | 8 | 1024.3 | 77.1 | 8.0 | 0 | 0 | 0 | 0 | 0 | 0 | 24 |
| 25 | 10.0 | 4.4 | 2.0 | 7.4 | 4.4 | 0.0 | W | 11.9 | 39 | 4 | 1032.0 | 84.4 | 7.1 | 0 | 0 | 0 | 0 | 0 | 0 | 25 |
| 26 | 10.1 | 5.9 | 4.2 | 7.0 | 4.4 | 0.0 | W | 11.8 | 39 | 2 | 1030.4 | 85.7 | 7.5 | 0 | 0 | 0 | 0 | 0 | 0 | 26 |
| 27 | 10.5 | 5.1 | 2.0 | 6.9 | 7.1 | 0.0 | W | 8.2 | 39 | 1 | 1030.0 | 89.1 | 7.2 | 0 | 0 | 0 | 0 | 0 | 0 | 27 |
| 28 | 6.7 | 0.3 | -2.2 | 6.6 | 0.9 | 0.0 | W | 3.1 | 16 | 8 | 1030.6 | 93.6 | 4.8 | 1 | 1 | 0 | 0 | 0 | 0 | 28 |
| 29 | 10.5 | 4.1 | 2.0 | 6.5 | 3.5 | 2.6 | SW | 6.9 | 23 | 8 | 1023.1 | 92.0 | 6.9 | 0 | 0 | 0 | 0 | 0 | 0 | 29 |
| 30 | 8.0 | 2.0 | -0.1 | 6.7 | 6.6 | TR | W | 6.4 | 30 | 1 | 1023.1 | 88.5 | 4.3 | 0 | 0 | 0 | 0 | 0 | 0 | 30 |
| 31 | 8.8 | 2.9 | 1.5 | 6.2 | 1.1 | 2.8 | SW | 15.6 | 60 | 8 | 1000.5 | 82.5 | 5.9 | 0 | 0 | 0 | 0 | 0 | 0 | 31 |
| Total/Mean | 9.7 | 5.0 | 3.3 | 6.5 | 75.9 | 58.6 | X | 9.0 | X | 5.9 | 1008.7 | 90.4 | 6.9 | 2 | 1 | 1 | 0 | 0 | 0 | Total/Mean |
| *Diff./% | +3.1 | +2.9 | 137% | 114% | *Diff./% | |||||||||||||||
| Date | Max. Temp. (°C) 09/09h | Min. Temp. (°C) 09/09h | Grass Min. Temp. (°C) 21/09h | Earth (30cms) Temp. (°C) 09h | Sun (Hours) 00/00h | R'fall (MM) 09/09h | Wind Dir'n 09h | Mean Wind Speed (MPH) 00/00h | Max. Gust Speed (MPH) 00/00h | Cloud Cover (Oktas) 09h | Mean MSL Air Pressure (mB) 00/00h | Mean Rel. Humd. (%) 00/00h | Mean Temp. (°C) 00/00h | Fog (vis. <1000m @ 09h) | Fog (vis. <200m @ 09h) | Snow or Rain and Snow 00/00h | Snow Lying @ 09h (>50% cover) | Hail 00/00h | Thunder 00/00h | Date |
Differences from average:
Differences from average shown in red. Reference periods used are as follows: Temperature 30 Years 1976/2005; rainfall 30 Years 1971/2000; sunshine 30 Years 1971/2000.
(*The differences from average quoted during the course of the month relate to the cumulative daily averages up to the date of the last observation, not the averages for the month as a whole)
Additional Data:
Rainfall Duration 64.6 hours
Air Frost Duration NIL hours
Graphs and Charts:
Click on the following links to view this month's graphs and charts.....
1. Daily Maximum, Minimum & Grass Minimum Temperatures
2. Daily Maximum & Minimum Temperatures (with 30 Year Comparative Means)
3. Daily Earth (30 cms Depth) Temperature @ 0900 GMT 4. Daily Rainfall 5. Daily Sunshine
6. Daily Maximum Gust & Mean Wind Speed 7. Daily Wind Direction @ 0900 GMT
8. Daily Mean MSL Air Pressure 9. Daily Mean Relative Humidity 10. Thermograph
11. Barograph 12. Hygrograph 13. Anemograph 14. Wind Direction
15. Sunshine Duration 16. Rainfall Intensity & Duration
January 2008 Weather Review:
......and click on the link below for a text report of the January 2008 weather in Royston
January (since 1973) at Royston (Iceni) Weather Station:
Mean day maximum temperature (30 years 1976/2005) 6.6°C
Mean night minimum temperature (30 years 1976/2005) 2.1°C
Highest temperature 14.2°C (6th January 1999); lowest temperature -12.7°C (14th January 1982)
Lowest grass minimum temperature -18.1°C (10th January 1982)
Warmest January 2007 (Mean temperature 7.4°C); coldest January 1979 (Mean temperature 0.1°C)
Average January rainfall (30 years 1971/2000) 51.2 mm
Wettest January 1995 (Rainfall 108.2 mm); driest January 1987 (Rainfall 9.6 mm)
Wettest Day 9th January 1992 (Rainfall 25.1 mm);
Highest number of "rain days" (0.2 mm or more) 25 (1988, 2004); lowest number of "rain days" 9 (1992)
Highest number of days with thunder 1 (1974, 1984. 1988, 1994, 1998 and 2004)
Highest number of air frosts 20 (1979, 1985)
Highest number of ground frosts 25 (1979)
Highest number of days with snow falling 15 (1985)
Highest number of days with snow lying (ground with more than 50% snow cover @ 0900 GMT) 17 (1985)
|
|
|
|
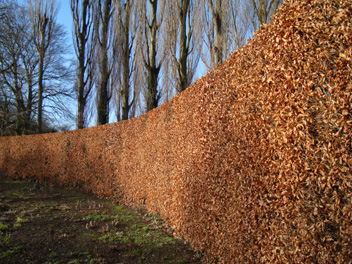
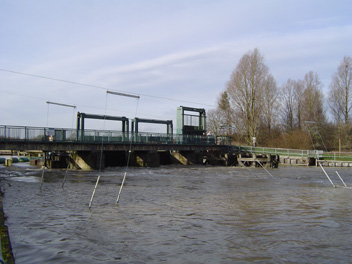
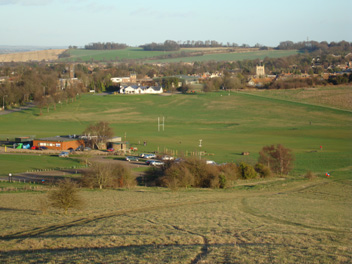
| This mature beech hedge borders the herbaceous garden at Anglesey Abbey (28 km NE of Royston), and being some 200 metres in length makes an impressive sight in the winter sunshine (5th January 2008 at 1144 GMT). The herbaceous garden itself is a blaze of colour in June and July but naturally is dormant at this time of the year. A statue of the Saxon god 'TIW' by J.M. Rysbrack (1694-1770) is placed at the centre of the pristine lawn to the left of the picture, but like most of the statues at Anglesey Abbey is covered during the Winter months for protection from the elements. At Royston the sunshine of the day ended at 1350 GMT, having accumulated a total of 5.0 hours by this time. | The first half of January was fairly wet in the region (but not excessively so at Royston) and streams and rivers in the catchments of the rivers Great Ouse and Nene to the N and NW of Royston were in spate for much of this time. This was the scene at Orton Staunch on the river Nene some 2 km upstream from the cathedral city of Peterborough (65 km NNW of Royston) at 1234 GMT on 16th January 2008. The normal waterfalls at this location have disappeared completely and the water is being allowed to flow straight through to ease the pressure on the upper parts of the catchment, resulting in very high water downstream from the locks. This is the last but one set of locks before the open sea. | This view of Royston from Therfield Heath has featured in these pages before but not in mid-Winter as in this photograph taken on 24th January 2008 (at 1513 GMT). The town of Royston in the middle distance is mostly hidden by trees although the tower of the 12th Century Parish Church of St. John the Baptist can be seen highlighted in the sunshine at the centre right of the picture. To the left of the photographer's vantage point the land drops away to the South Cambridgeshire Plain, whilst visible in the distance is Hyde Hill to the E and NE of the town. With low pressure centres in the Denmark Strait and to the S of Iceland, and high pressure over the Bay of Biscay, a strong WNW wind is traversing the Heath. |
Return to Welcome to Royston (Iceni) Weather Station page
(This page last updated 12th February 2008 2036 GMT)