
Royston (Iceni) Weather Station
Daily Weather Observations - June 2008
(All Times GMT)
| Date | Max. Temp. (°C) 09/09h | Min. Temp. (°C) 09/09h | Grass Min. Temp. (°C) 21/09h | Earth (30cms) Temp. (°C) 09h | Sun (Hours) 00/00h | R'fall (MM) 09/09h | Wind Dir'n 09h | Mean Wind Speed (MPH) 00/00h | Max. Gust Speed (MPH) 00/00h | Cloud Cover (Oktas) 09h | Mean MSL Air Pressure (mB) 00/00h | Mean Rel. Humd. (%) 00/00h | Mean Temp. (°C) 00/00h | Fog (vis. <1000m @ 09h) | Fog (vis. <200m @ 09h) | Snow or Rain and Snow 00/00h | Snow Lying @ 09h (>50% cover) | Hail 00/00h | Thunder 00/00h | Date |
| 1 | 15.7 | 11.0 | 7.6 | 16.2 | 0.1 | TR | NE | 0.5 | 9 | 8 | 1011.9 | 96.7 | 12.5 | 0 | 0 | 0 | 0 | 0 | 0 | 1 |
| 2 | 17.5 | 12.0 | 9.4 | 15.6 | 0.1 | 10.0 | NE | 0.5 | 9 | 8 | 1009.4 | 92.7 | 14.8 | 0 | 0 | 0 | 0 | 0 | 0 | 2 |
| 3 | 14.9 | 12.5 | 12.2 | 15.9 | 0.0 | 11.9 | NW | 3.3 | 23 | 8 | 1008.5 | 99.9 | 12.8 | 1 | 0 | 0 | 0 | 0 | 0 | 3 |
| 4 | 20.0 | 10.7 | 10.9 | 15.5 | 5.8 | 0.0 | W | 2.7 | 18 | 7 | 1012.8 | 77.5 | 14.5 | 0 | 0 | 0 | 0 | 0 | 0 | 4 |
| 5 | 21.5 | 10.4 | 7.7 | 16.0 | 11.3 | 0.0 | W | 2.3 | 14 | 2 | 1012.8 | 69.4 | 16.2 | 0 | 0 | 0 | 0 | 0 | 0 | 5 |
| 6 | 18.0 | 10.9 | 9.9 | 16.7 | 0.7 | 6.2 | NW | 2.3 | 14 | 8 | 1013.3 | 90.4 | 14.1 | 0 | 0 | 0 | 0 | 0 | 0 | 6 |
| 7 | 16.9 | 10.2 | 9.3 | 16.4 | 0.0 | TR | NW | 3.1 | 16 | 7 | 1016.0 | 93.6 | 13.5 | 0 | 0 | 0 | 0 | 0 | 0 | 7 |
| 8 | 23.9 | 12.0 | 8.7 | 16.3 | 10.6 | 0.0 | N | 2.0 | 16 | 8 | 1020.2 | 84.9 | 16.6 | 0 | 0 | 0 | 0 | 0 | 0 | 8 |
| 9 | 25.8 | 11.1 | 7.4 | 17.1 | 15.4 | 0.0 | N | 1.4 | 16 | 1 | 1021.3 | 64.5 | 19.2 | 0 | 0 | 0 | 0 | 0 | 0 | 9 |
| 10 | 23.0 | 14.3 | 10.1 | 17.9 | 10.7 | 0.0 | NW | 4.3 | 21 | 8 | 1020.2 | 70.9 | 17.6 | 0 | 0 | 0 | 0 | 0 | 0 | 10 |
| 11 | 20.5 | 9.7 | 7.2 | 17.6 | 4.1 | 4.8 | NW | 5.0 | 28 | 7 | 1018.9 | 71.6 | 14.8 | 0 | 0 | 0 | 0 | 0 | 0 | 11 |
| 12 | 15.0 | 10.5 | 9.9 | 17.6 | 2.6 | 0.2 | NE | 3.2 | 28 | 7 | 1014.9 | 86.5 | 11.1 | 0 | 0 | 0 | 0 | 0 | 0 | 12 |
| 13 | 17.9 | 7.1 | 3.3 | 16.8 | 4.4 | 0.2 | W | 4.3 | 21 | 6 | 1014.3 | 73.5 | 12.3 | 0 | 0 | 0 | 0 | 0 | 0 | 13 |
| 14 | 19.9 | 7.5 | 3.6 | 16.8 | 8.9 | 1.2 | NW | 4.6 | 23 | 2 | 1011.4 | 70.5 | 13.4 | 0 | 0 | 0 | 0 | 0 | 0 | 14 |
| 15 | 18.7 | 7.5 | 3.5 | 17.0 | 10.0 | 0.0 | NW | 3.5 | 21 | 3 | 1008.0 | 72.6 | 12.5 | 0 | 0 | 0 | 0 | 0 | 0 | 15 |
| 16 | 19.5 | 6.4 | 2.7 | 16.9 | 7.2 | TR | N | 1.6 | 14 | 7 | 1008.6 | 74.4 | 12.4 | 0 | 0 | 0 | 0 | 0 | 0 | 16 |
| 17 | 20.0 | 9.6 | 8.3 | 17.0 | 8.6 | TR | SW | 6.4 | 23 | 4 | 1008.8 | 67.4 | 15.1 | 0 | 0 | 0 | 0 | 0 | 0 | 17 |
| 18 | 18.5 | 10.5 | 9.1 | 16.9 | 0.1 | 0.1 | S | 9.4 | 37 | 8 | 1007.4 | 79.3 | 14.6 | 0 | 0 | 0 | 0 | 0 | 0 | 18 |
| 19 | 20.6 | 13.0 | 12.1 | 16.7 | 7.5 | 0.0 | W | 9.9 | 39 | 3 | 1005.6 | 68.6 | 15.9 | 0 | 0 | 0 | 0 | 0 | 0 | 19 |
| 20 | 19.6 | 11.1 | 9.3 | 17.0 | 4.6 | 1.4 | W | 6.2 | 23 | 7 | 1014.1 | 75.5 | 15.4 | 0 | 0 | 0 | 0 | 0 | 0 | 20 |
| 21 | 19.1 | 12.4 | 11.7 | 17.1 | 0.0 | 1.1 | SE | 3.5 | 25 | 8 | 1013.1 | 91.7 | 15.4 | 0 | 0 | 0 | 0 | 0 | 0 | 21 |
| 22 | 21.2 | 16.1 | 15.0 | 17.0 | 12.8 | 0.0 | SW | 12.6 | 41 | 4 | 1006.2 | 71.2 | 17.4 | 0 | 0 | 0 | 0 | 0 | 0 | 22 |
| 23 | 21.0 | 10.9 | 9.3 | 17.4 | 11.4 | 0.0 | W | 5.3 | 32 | 5 | 1015.9 | 65.6 | 15.8 | 0 | 0 | 0 | 0 | 0 | 0 | 23 |
| 24 | 20.7 | 11.2 | 8.0 | 17.5 | 7.3 | 0.0 | SE | 3.5 | 21 | 3 | 1014.8 | 72.7 | 15.8 | 0 | 0 | 0 | 0 | 0 | 0 | 24 |
| 25 | 22.2 | 12.0 | 10.5 | 17.6 | 10.8 | 0.0 | SW | 8.8 | 39 | 1 | 1011.4 | 69.3 | 17.0 | 0 | 0 | 0 | 0 | 0 | 0 | 25 |
| 26 | 22.0 | 10.8 | 8.7 | 17.7 | 10.0 | 1.4 | W | 8.9 | 37 | 2 | 1014.2 | 73.7 | 16.1 | 0 | 0 | 0 | 0 | 0 | 0 | 26 |
| 27 | 20.8 | 11.9 | 9.5 | 17.9 | 7.0 | 0.0 | W | 8.8 | 35 | 1 | 1013.0 | 78.5 | 17.0 | 0 | 0 | 0 | 0 | 0 | 0 | 27 |
| 28 | 22.5 | 16.3 | 15.8 | 18.3 | 10.3 | 0.0 | W | 9.2 | 32 | 4 | 1013.6 | 69.6 | 18.4 | 0 | 0 | 0 | 0 | 0 | 0 | 28 |
| 29 | 22.5 | 12.0 | 10.1 | 18.4 | 11.8 | 0.0 | W | 8.8 | 35 | 4 | 1013.3 | 70.2 | 16.9 | 0 | 0 | 0 | 0 | 0 | 0 | 29 |
| 30 | 22.4 | 11.0 | 8.5 | 18.2 | 13.3 | 0.0 | W | 5.0 | 21 | 1 | 1016.8 | 66.0 | 17.1 | 0 | 0 | 0 | 0 | 0 | 0 | 30 |
| Total/Mean | 20.1 | 11.1 | 9.0 | 17.0 | 207.0 | 38.5 | X | 5.0 | X | 5.1 | 1013.0 | 77.0 | 15.2 | 0 | 0 | 0 | 0 | 0 | 0 | Total/Mean |
| *Diff./% | +0.2 | +0.5 | 115% | 77% | *Diff./% | |||||||||||||||
| Date | Max. Temp. (°C) 09/09h | Min. Temp. (°C) 09/09h | Grass Min. Temp. (°C) 21/09h | Earth (30cms) Temp. (°C) 09h | Sun (Hours) 00/00h | R'fall (MM) 09/09h | Wind Dir'n 09h | Mean Wind Speed (MPH) 00/00h | Max. Gust Speed (MPH) 00/00h | Cloud Cover (Oktas) 09h | Mean MSL Air Pressure (mB) 00/00h | Mean Rel. Humd. (%) 00/00h | Mean Temp. (°C) 00/00h | Fog (vis. <1000m @ 09h) | Fog (vis. <200m @ 09h) | Snow or Rain and Snow 00/00h | Snow Lying @ 09h (>50% cover) | Hail 00/00h | Thunder 00/00h | Date |
Differences from average:
Differences from average shown in red. Reference periods used are as follows: Temperature 30 Years 1976/2005; rainfall 30 Years 1971/2000; sunshine 30 Years 1971/2000.
(*The differences from average quoted during the course of the month relate to the cumulative daily averages up to the date of the last observation, not the averages for the month as a whole)
Additional Data:
Rainfall Duration 51.3 hours
Air Frost Duration NIL hours
Graphs and Charts:
Click on the following links to view this month's graphs and charts.....
1. Daily Maximum, Minimum & Grass Minimum Temperatures
2. Daily Maximum & Minimum Temperatures (with 30 Year Comparative Means)
3. Daily Earth (30 cms Depth) Temperature @ 0900 GMT 4. Daily Rainfall 5. Daily Sunshine
6. Daily Maximum Gust & Mean Wind Speed 7. Daily Wind Direction @ 0900 GMT
8. Daily Mean MSL Air Pressure 9. Daily Mean Relative Humidity 10. Thermograph
11. Barograph 12. Hygrograph 13. Anemograph 14. Wind Direction
15. Sunshine Duration 16. Rainfall Intensity & Duration
June 2008 Weather Review:
......and click on the link below for a text report of the June 2008 weather in Royston
June (since 1972) at Royston (Iceni) Weather Station:
Mean daily maximum temperature (30 years 1976/2005) 19.9°C
Mean daily minimum temperature (30 years 1976/2005) 10.6°C
Highest temperature 33.7°C (26th June 1976); lowest temperature 2.2°C (3rd June 1975)
Lowest grass minimum temperature -1.0°C (2nd June 1991)
Warmest June 1976 (Mean temperature 18.3°C); coldest June 1977 (Mean temperature 12.5°C)
Average June rainfall (30 years 1971/2000) 50.2 mm
Wettest June 1985 (Rainfall 135.4 mm); driest June 1996 (Rainfall 8.0 mm)
Wettest Day 19th June 1973 (Rainfall 36.8 mm);
Highest number of "rain days" (0.2 mm or more) 23 (1997); lowest number of "rain days" 3 (1976, 1996)
Highest number of days with thunder 10 (1982)
Highest number of air frosts 0
Highest number of ground frosts 2 (1989)
Highest number of days with snow falling 1 (1975)
Highest number of days with snow lying (ground with more than 50% snow cover @ 0900 GMT) 0
|
|
|
|
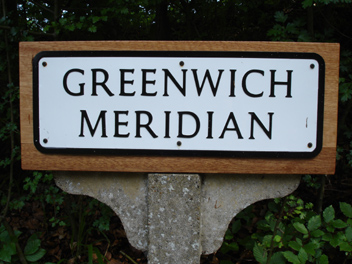
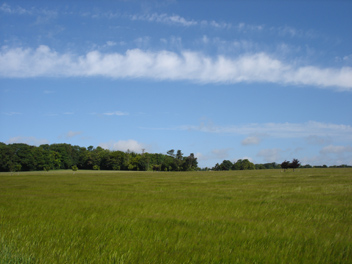
| This is the new 'Greenwich Meridian' sign in Newmarket Road, Royston on the ascent to Hyde Hill to the east of the town. The new sign has replaced a similar one which had stood on the site for many years but which had been damaged. The Greenwich Meridian (0° Longitude) itself just clips the eastern fringes of Royston, so the town itself is positioned just inside the Western Hemisphere. Just 5 km to the south of this point the land rises to over 150 metres on the East Anglian Heights, and following the meridian northwards from this location there is no higher ground all the way to the North Pole, a distance of 4233 km! Additionally, the town of Royston lies just inside Hertfordshire on the Hertfordshire/Cambridgeshire county line so can be classed as a true 'border' town! | On 22nd June 2008 the Royston Allotments & Gardens Association held its annual outing, this year to Houghton Hall in Norfolk (approximately 100 km NNE of Royston). As well as the magnificent stately home pictured above (on the day), the estate includes a renovated 5 acre walled garden, park, church, stables and museum. The park is populated by 1000 head of deer, which owe their rare white colour to the way they have been managed over the last 70 years. Clear air and bright sunshine was accompanied by a very strong (for a Summer month) wind, and a small branch which has blown a considerable distance can be seen on the grass to the right of the picture. A maximum wind gust speed of 41 mph was recorded at Royston on this day (sunshine 12.8 hours). | This narrow band of cloud drifted slowly eastwards over Royston in the morning of 26th June 2008 and was here pictured from the Burloes estate close to the B1039 Royston to Saffron Walden road at 0804 GMT. This band of cloud was visible on 0800 GMT satellite images and appeared to stretch from the Wash for about 100 km south-westwards. It soon started to diffuse, however, and had disappeared from satellite images by 0900 GMT. The barley crop seen in the picture marks a return of this land to cultivation this year after a period of about 8 years as grassland. A westerly wind of mean speed 9 knots gusting to 16 knots is bending the barley ears in a temperature of 16.8°C. This day was rather breezy with a maximum gust speed of 34 knots recorded (at 1340 GMT). |
Return to Welcome to Royston (Iceni) Weather Station page
(This page last updated 11th July 2008 1956 GMT)