Royston (Iceni) Weather Station
Daily Weather Observations - October 2008
(All Times GMT)
| Date | Max. Temp. (°C) 09/09h | Min. Temp. (°C) 09/09h | Grass Min. Temp. (°C) 21/09h | Earth (30cms) Temp. (°C) 09h | Sun (Hours) 00/00h | R'fall (MM) 09/09h | Wind Dir'n 09h | Mean Wind Speed (MPH) 00/00h | Max. Gust Speed (MPH) 00/00h | Cloud Cover (Oktas) 09h | Mean MSL Air Pressure (mB) 00/00h | Mean Rel. Humd. (%) 00/00h | Mean Temp. (°C) 00/00h | Fog (vis. <1000m @ 09h) | Fog (vis. <200m @ 09h) | Snow or Rain and Snow 00/00h | Snow Lying @ 09h (>50% cover) | Hail 00/00h | Thunder 00/00h | Date |
| 1 | 15.2 | 10.3 | 7.5 | 14.4 | 6.4 | 1.0 | W | 12.4 | 46 | 5 | 996.7 | 75.8 | 11.6 | 0 | 0 | 0 | 0 | 0 | 0 | 1 |
| 2 | 13.6 | 6.0 | 3.5 | 13.8 | 5.0 | 0.1 | NW | 6.4 | 28 | 6 | 1000.9 | 78.2 | 8.5 | 0 | 0 | 0 | 0 | 0 | 0 | 2 |
| 3 | 10.2 | 5.5 | 3.9 | 13.1 | 1.4 | 0.2 | NW | 5.3 | 30 | 2 | 1010.2 | 80.8 | 7.1 | 0 | 0 | 0 | 0 | 0 | 0 | 3 |
| 4 | 15.3 | 3.4 | -0.7 | 12.6 | 0.4 | 4.9 | SW | 10.3 | 41 | 7 | 1008.2 | 86.4 | 9.2 | 0 | 0 | 0 | 0 | 0 | 0 | 4 |
| 5 | 15.4 | 12.6 | 12.0 | 12.9 | 0.1 | 4.5 | SW | 6.3 | 35 | 8 | 997.1 | 97.6 | 10.7 | 0 | 0 | 0 | 0 | 0 | 0 | 5 |
| 6 | 15.9 | 2.7 | -1.6 | 12.4 | 5.0 | 0.3 | SE | 2.6 | 18 | 8 | 1008.8 | 94.3 | 9.6 | 0 | 0 | 0 | 0 | 0 | 0 | 6 |
| 7 | 17.7 | 11.9 | 9.8 | 12.9 | 0.7 | 0.4 | S | 8.1 | 37 | 8 | 1003.0 | 94.1 | 14.5 | 0 | 0 | 0 | 0 | 0 | 0 | 7 |
| 8 | 17.1 | 8.4 | 4.7 | 13.0 | 9.5 | 0.0 | W | 3.8 | 23 | 0 | 1016.1 | 83.5 | 11.2 | 0 | 0 | 0 | 0 | 0 | 0 | 8 |
| 9 | 17.8 | 6.5 | 1.4 | 12.5 | 9.7 | 0.0 | S | 4.1 | 21 | 0 | 1027.1 | 83.9 | 11.8 | 0 | 0 | 0 | 0 | 0 | 0 | 9 |
| 10 | 18.5 | 10.9 | 8.4 | 12.4 | 8.9 | 0.0 | SW | 8.7 | 32 | 2 | 1025.0 | 84.9 | 13.5 | 0 | 0 | 0 | 0 | 0 | 0 | 10 |
| 11 | 19.1 | 9.0 | 7.5 | 12.6 | 9.8 | 0.0 | SW | 6.0 | 30 | 0 | 1022.7 | 84.7 | 13.3 | 0 | 0 | 0 | 0 | 0 | 0 | 11 |
| 12 | 21.6 | 8.2 | 4.0 | 12.4 | 9.8 | 0.0 | S | 3.9 | 18 | 1 | 1019.9 | 90.3 | 15.0 | 0 | 0 | 0 | 0 | 0 | 0 | 12 |
| 13 | 17.5 | 14.0 | 11.9 | 12.7 | 1.3 | 0.0 | SW | 5.3 | 23 | 8 | 1014.2 | 91.5 | 14.6 | 0 | 0 | 0 | 0 | 0 | 0 | 13 |
| 14 | 15.5 | 10.9 | 6.1 | 12.9 | 2.3 | 1.4 | S | 4.0 | 18 | 6 | 1016.0 | 94.6 | 13.0 | 0 | 0 | 0 | 0 | 0 | 0 | 14 |
| 15 | 16.3 | 12.4 | 9.9 | 13.0 | 0.0 | 1.0 | SW | 6.1 | 25 | 8 | 1008.7 | 94.8 | 12.7 | 0 | 0 | 0 | 0 | 0 | 0 | 15 |
| 16 | 14.1 | 7.7 | 5.0 | 13.0 | 7.5 | 0.0 | NW | 6.3 | 30 | 2 | 1011.8 | 82.4 | 9.3 | 0 | 0 | 0 | 0 | 0 | 0 | 16 |
| 17 | 14.8 | 5.5 | 3.0 | 12.1 | 6.9 | 0.0 | NW | 4.2 | 18 | 3 | 1017.2 | 82.9 | 9.2 | 0 | 0 | 0 | 0 | 0 | 0 | 17 |
| 18 | 15.7 | 6.7 | 5.0 | 11.9 | 6.9 | 0.0 | W | 6.4 | 28 | 5 | 1015.3 | 86.0 | 10.4 | 0 | 0 | 0 | 0 | 0 | 0 | 18 |
| 19 | 14.9 | 7.5 | 6.0 | 11.5 | 2.6 | 0.0 | SW | 8.6 | 32 | 6 | 1013.7 | 86.6 | 11.2 | 0 | 0 | 0 | 0 | 0 | 0 | 19 |
| 20 | 15.3 | 12.4 | 10.5 | 11.9 | 0.0 | 8.1 | SW | 9.7 | 41 | 8 | 1003.1 | 91.2 | 12.2 | 0 | 0 | 0 | 0 | 0 | 0 | 20 |
| 21 | 13.1 | 7.0 | 4.9 | 11.9 | 8.9 | 0.0 | W | 7.2 | 28 | 0 | 1008.0 | 80.0 | 8.8 | 0 | 0 | 0 | 0 | 0 | 0 | 21 |
| 22 | 13.6 | 4.3 | 2.5 | 11.0 | 8.7 | TR | SW | 5.5 | 23 | 0 | 1018.6 | 83.5 | 8.0 | 0 | 0 | 0 | 0 | 0 | 0 | 22 |
| 23 | 14.4 | 6.7 | 5.2 | 10.5 | 1.7 | 1.5 | SW | 11.2 | 44 | 6 | 1016.5 | 86.3 | 11.3 | 0 | 0 | 0 | 0 | 0 | 0 | 23 |
| 24 | 13.5 | 9.6 | 9.1 | 11.1 | 6.1 | 0.0 | NW | 6.2 | 32 | 8 | 1018.9 | 83.1 | 10.5 | 0 | 0 | 0 | 0 | 0 | 0 | 24 |
| 25 | 14.4 | 4.1 | 2.5 | 10.8 | 3.7 | 3.6 | SW | 9.9 | 44 | 7 | 1022.8 | 85.6 | 9.7 | 0 | 0 | 0 | 0 | 0 | 0 | 25 |
| 26 | 12.6 | 12.4 | 12.1 | 11.0 | 0.2 | 1.8 | W | 7.5 | 37 | 8 | 1011.0 | 96.1 | 11.5 | 0 | 0 | 0 | 0 | 0 | 0 | 26 |
| 27 | 10.5 | 4.8 | 2.6 | 11.0 | 7.3 | 0.0 | W | 7.5 | 37 | 0 | 1006.7 | 86.5 | 6.1 | 0 | 0 | 0 | 0 | 0 | 0 | 27 |
| 28 | 8.3 | 1.0 | -1.5 | 9.9 | 5.2 | 19.9 | W | 3.1 | 18 | 0 | 1007.8 | 96.2 | 2.9 | 0 | 0 | 1 | 0 | 0 | 0 | 28 |
| 29 | 7.4 | -2.5 | -6.0 | 8.7 | 7.5 | 0.0 | NW | 1.3 | 12 | 0 | 1004.4 | 91.1 | 1.5 | 0 | 0 | 0 | 0 | 0 | 0 | 29 |
| 30 | 8.9 | 0.3 | -2.5 | 7.9 | 2.8 | 1.0 | NE | 1.5 | 28 | 7 | 995.7 | 93.8 | 3.0 | 0 | 0 | 0 | 0 | 0 | 0 | 30 |
| 31 | 9.1 | -1.1 | -4.6 | 7.6 | 6.9 | 3.5 | N | 0.9 | 21 | 2 | 1005.3 | 95.8 | 2.4 | 0 | 0 | 0 | 0 | 0 | 0 | 31 |
| Total/Mean | 14.4 | 7.1 | 4.6 | 11.8 | 153.0 | 53.2 | X | 6.1 | X | 4.3 | 1011.3 | 87.8 | 9.8 | 0 | 0 | 1 | 0 | 0 | 0 | Total/Mean |
| *Diff./% | -0.2 | -0.9 | 133% | 93% | *Diff./% | |||||||||||||||
| Date | Max. Temp. (°C) 09/09h | Min. Temp. (°C) 09/09h | Grass Min. Temp. (°C) 21/09h | Earth (30cms) Temp. (°C) 09h | Sun (Hours) 00/00h | R'fall (MM) 09/09h | Wind Dir'n 09h | Mean Wind Speed (MPH) 00/00h | Max. Gust Speed (MPH) 00/00h | Cloud Cover (Oktas) 09h | Mean MSL Air Pressure (mB) 00/00h | Mean Rel. Humd. (%) 00/00h | Mean Temp. (°C) 00/00h | Fog (vis. <1000m @ 09h) | Fog (vis. <200m @ 09h) | Snow or Rain and Snow 00/00h | Snow Lying @ 09h (>50% cover) | Hail 00/00h | Thunder 00/00h | Date |
Differences from average:
Differences from average shown in red. Reference periods used are as follows: Temperature 30 Years 1976/2005; rainfall 30 Years 1971/2000; sunshine 30 Years 1971/2000.
(*The differences from average quoted during the course of the month relate to the cumulative daily averages up to the date of the last observation, not the averages for the month as a whole)
Additional Data:
Rainfall Duration 49.4 hours
Air Frost Duration 11.8 hours
Graphs and Charts:
Click on the following links to view this month's graphs and charts.....
1. Daily Maximum, Minimum & Grass Minimum Temperatures
2. Daily Maximum & Minimum Temperatures (with 30 Year Comparative Means)
3. Daily Earth (30 cms Depth) Temperature @ 0900 GMT 4. Daily Rainfall 5. Daily Sunshine
6. Daily Maximum Gust & Mean Wind Speed 7. Daily Wind Direction @ 0900 GMT
8. Daily Mean MSL Air Pressure 9. Daily Mean Relative Humidity 10. Thermograph
11. Barograph 12. Hygrograph 13. Anemograph 14. Wind Direction
15. Sunshine Duration 16. Rainfall Intensity & Duration
October 2008 Weather Review:
......and click on the link below for a text report of the October 2008 weather in Royston
October (since 1972) at Royston (Iceni) Weather Station:
Mean day maximum temperature (30 years 1976/2005) 14.6°C
Mean night minimum temperature (30 years 1976/2005) 8.0°C
Highest temperature 27.5°C (1st October 1985); lowest temperature -3.6°C (29th October 1997)
Lowest grass minimum temperature -8.3°C (29th October 1997)
Warmest October 2001 (Mean temperature 14.3°C); coldest October 1974 (Mean temperature 7.3°C)
Highest no. of days with air frost 5 (1997); highest no. of days with ground frost 13 (2003)
Average October rainfall (30 years 1971/2000) 57.0 mm
Wettest October 2001 (Rainfall 137.8 mm); driest October 1972 (Rainfall 4.1 mm)
Wettest Day 20th October 2001 (Rainfall 51.8 mm);
Highest number of "rain days" (0.2 mm or more) 23 (2000); lowest number of "rain days" 3 (1972)
Highest number of days with thunder 3 (1984)
|
|
|
|
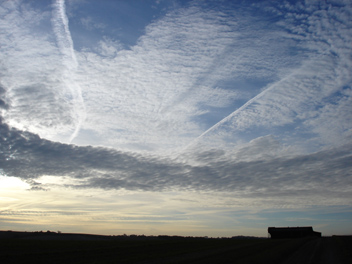
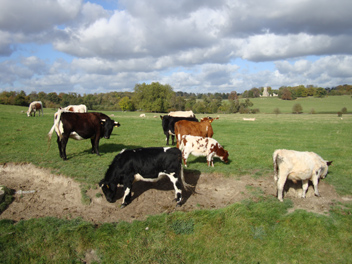
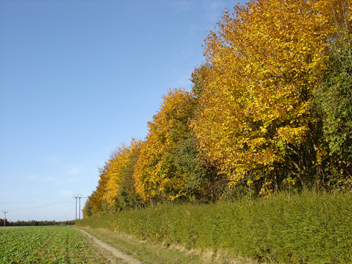
| This early morning cloud study was viewed on 19th October 2008 at 0750 GMT between Royston and Barley. Two contrails clearly stand out from the cloud whilst what appears to be the shadow of a third contrail can be seen to the left of and parallel to the the right hand contrail. Royston is under the influence of large anticyclone centred over SE Europe whilst a deep depression is moving east between Iceland and Scotland increasingly tightening the pressure gradient and consequently strengthening the wind. At the time the photograph was taken a SW wind of 6 knots gusting to 12 knots is in evidence in a temperature of 8.1°C. Sunshine for the day was restricted to 2.6 hours. | A tranquil scene on the Wimpole estate in Cambridgeshire some 10 km N of Royston, at 1209 GMT on 21st October 2008. The cattle seen in this photograph belong to the largest rare breeds centre in East Anglia which is located at Wimpole. Just discernible in the distance is the 1774 built Gothic Tower on Johnson's Hill whilst out of view in the valley in between is the lake and Chinese Bridge. A keen westerly wind is sweeping across the estate and at this time the wind speed at Royston was measured as 10 knots gusting to 24 knots in a temperature of 12.2°C. The cloud seen in the picture has built up quickly after a sunny morning in essentially clear skies. Sunshine for the day was 8.9 hours. | This Autumn has produced an abundance of leaf colours, and the sycamore trees in this plantation on the Burloes estate to the SE of Royston (as seen at 0958 GMT on 27th October 2008) are providing a spectacular display in the morning sunshine. This plantation was set in the early 1970's adjacent to a mature wood (which was all but destroyed in the great gale of 16th October 1987 and has since been re-planted). It is hard to believe that only the next day, 28th, Royston experience its first snowfall in October since records began at Royston (Iceni) Weather Station in 1972, and the temperature plunged to its lowest level since 29th October 1997! The temperature at this time was 6.9°C and daily sunshine was 7.3 hours. |
Return to Welcome to Royston (Iceni) Weather Station page
(This page last updated 10th November 2008 2037 GMT)