Royston (Iceni) Weather Station
Daily Weather Observations - December 2008
(All Times GMT)
| Date | Max. Temp. (°C) 09/09h | Min. Temp. (°C) 09/09h | Grass Min. Temp. (°C) 21/09h | Earth (30cms) Temp. (°C) 09h | Sun (Hours) 00/00h | R'fall (MM) 09/09h | Wind Dir'n 09h | Mean Wind Speed (MPH) 00/00h | Max. Gust Speed (MPH) 00/00h | Cloud Cover (Oktas) 09h | Mean MSL Air Pressure (mB) 00/00h | Mean Rel. Humd. (%) 00/00h | Mean Temp. (°C) 00/00h | Fog (vis. <1000m @ 09h) | Fog (vis. <200m @ 09h) | Snow or Rain and Snow 00/00h | Snow Lying @ 09h (>50% cover) | Hail 00/00h | Thunder 00/00h | Date |
| 1 | 4.5 | 0.3 | -1.2 | 6.5 | 5.8 | 0.2 | NW | 5.5 | 21 | 4 | 1001.2 | 95.4 | 2.2 | 0 | 0 | 0 | 0 | 0 | 0 | 1 |
| 2 | 4.0 | -0.5 | -3.0 | 6.0 | 2.7 | 1.5 | SW | 5.8 | 23 | 1 | 1001.1 | 94.8 | 1.5 | 0 | 0 | 0 | 0 | 0 | 0 | 2 |
| 3 | 3.9 | -1.4 | -4.5 | 5.5 | 5.8 | 3.5 | NW | 3.7 | 21 | 6 | 997.7 | 96.4 | 0.8 | 0 | 0 | 0 | 0 | 0 | 0 | 3 |
| 4 | 7.5 | 0.7 | -0.2 | 5.0 | 4.2 | 1.4 | S | 9.0 | 41 | 8 | 979.8 | 93.6 | 4.2 | 0 | 0 | 0 | 0 | 0 | 0 | 4 |
| 5 | 6.1 | 1.7 | -1.5 | 5.0 | 2.8 | 1.7 | W | 6.0 | 25 | 7 | 984.0 | 95.1 | 4.0 | 0 | 0 | 0 | 0 | 0 | 0 | 5 |
| 6 | 6.3 | 2.1 | 0.0 | 5.2 | 5.6 | 0.0 | W | 3.5 | 21 | 7 | 1010.6 | 96.1 | 2.9 | 0 | 0 | 0 | 0 | 0 | 0 | 6 |
| 7 | 5.7 | -1.0 | -5.6 | 4.7 | 6.8 | 0.0 | W | 2.2 | 16 | 0 | 1024.5 | 96.1 | 1.9 | 0 | 0 | 0 | 0 | 0 | 0 | 7 |
| 8 | 5.8 | 2.7 | 0.7 | 4.1 | 2.0 | 2.6 | S | 5.9 | 25 | 8 | 1018.8 | 97.8 | 4.1 | 0 | 0 | 0 | 0 | 0 | 0 | 8 |
| 9 | 4.5 | -0.2 | -2.5 | 4.5 | 4.7 | 0.0 | W | 4.2 | 18 | 0 | 1016.7 | 96.7 | 1.6 | 0 | 0 | 0 | 0 | 0 | 0 | 9 |
| 10 | 4.0 | -1.5 | -4.5 | 4.1 | 6.8 | 0.2 | NW | 4.3 | 16 | 3 | 1014.4 | 90.0 | 0.9 | 0 | 0 | 0 | 0 | 0 | 0 | 10 |
| 11 | 3.5 | 0.9 | -0.5 | 3.8 | 2.5 | 0.0 | NW | 4.0 | 16 | 8 | 1008.9 | 98.2 | 1.3 | 0 | 0 | 0 | 0 | 0 | 0 | 11 |
| 12 | 7.6 | -2.0 | -4.5 | 3.7 | 0.6 | 0.6 | S | 7.4 | 39 | 7 | 1007.8 | 98.6 | 2.5 | 0 | 0 | 0 | 0 | 0 | 0 | 12 |
| 13 | 4.2 | 3.9 | 3.1 | 4.1 | 0.0 | 9.9 | S | 8.8 | 44 | 8 | 988.3 | 97.4 | 3.8 | 0 | 0 | 0 | 0 | 0 | 0 | 13 |
| 14 | 4.1 | 1.6 | 1.0 | 4.5 | 0.1 | 0.0 | NW | 1.9 | 14 | 8 | 998.0 | 99.5 | 2.8 | 0 | 0 | 0 | 0 | 0 | 0 | 14 |
| 15 | 5.2 | 2.8 | 2.6 | 4.9 | 0.0 | 0.0 | N | 1.4 | 18 | 8 | 1015.2 | 99.5 | 3.6 | 0 | 0 | 0 | 0 | 0 | 0 | 15 |
| 16 | 7.9 | 1.5 | 1.4 | 5.1 | 0.0 | 0.3 | S | 5.2 | 28 | 8 | 1011.7 | 99.3 | 3.1 | 0 | 0 | 0 | 0 | 0 | 0 | 16 |
| 17 | 9.5 | 2.3 | -0.5 | 5.3 | 6.7 | 0.0 | NW | 4.9 | 23 | 0 | 1011.4 | 92.2 | 4.6 | 0 | 0 | 0 | 0 | 0 | 0 | 17 |
| 18 | 10.8 | 4.5 | 4.0 | 5.0 | 2.1 | 0.2 | SW | 8.3 | 30 | 7 | 1013.5 | 93.8 | 8.8 | 0 | 0 | 0 | 0 | 0 | 0 | 18 |
| 19 | 11.5 | 3.2 | 0.8 | 5.6 | 4.6 | 0.0 | W | 9.4 | 46 | 3 | 1019.2 | 87.3 | 6.3 | 0 | 0 | 0 | 0 | 0 | 0 | 19 |
| 20 | 13.1 | 10.1 | 8.7 | 5.8 | 1.7 | 0.0 | SW | 11.5 | 44 | 7 | 1021.0 | 92.6 | 10.8 | 0 | 0 | 0 | 0 | 0 | 0 | 20 |
| 21 | 12.0 | 8.0 | 5.9 | 6.5 | 5.2 | TR | SW | 11.0 | 39 | 2 | 1026.4 | 90.5 | 9.8 | 0 | 0 | 0 | 0 | 0 | 0 | 21 |
| 22 | 11.0 | 9.8 | 8.0 | 6.7 | 0.0 | TR | W | 4.5 | 30 | 8 | 1031.2 | 96.1 | 10.2 | 0 | 0 | 0 | 0 | 0 | 0 | 22 |
| 23 | 9.1 | 8.7 | 8.3 | 7.3 | 0.0 | 0.1 | SW | 2.2 | 16 | 8 | 1033.6 | 96.5 | 8.3 | 0 | 0 | 0 | 0 | 0 | 0 | 23 |
| 24 | 9.0 | 5.9 | 5.2 | 7.4 | 1.5 | 0.0 | W | 1.2 | 12 | 8 | 1032.5 | 88.9 | 6.4 | 0 | 0 | 0 | 0 | 0 | 0 | 24 |
| 25 | 6.2 | 3.0 | -0.5 | 7.1 | 0.0 | 0.0 | NE | 2.1 | 18 | 8 | 1033.3 | 94.8 | 5.0 | 0 | 0 | 0 | 0 | 0 | 0 | 25 |
| 26 | 3.9 | -0.2 | -3.4 | 6.9 | 4.3 | 0.0 | E | 2.4 | 21 | 1 | 1036.6 | 92.4 | 1.4 | 0 | 0 | 0 | 0 | 0 | 0 | 26 |
| 27 | 1.8 | -2.0 | -4.5 | 5.8 | 0.6 | 0.0 | NE | 2.5 | 18 | 0 | 1035.0 | 96.4 | -0.1 | 0 | 0 | 0 | 0 | 0 | 0 | 27 |
| 28 | 2.7 | -1.6 | -3.5 | 5.3 | 4.7 | 0.0 | E | 3.0 | 18 | 0 | 1028.5 | 95.1 | 0.6 | 0 | 0 | 0 | 0 | 0 | 0 | 28 |
| 29 | 1.9 | -0.5 | -1.8 | 4.9 | 0.1 | 0.0 | E | 1.3 | 16 | 8 | 1027.1 | 87.9 | 0.7 | 0 | 0 | 0 | 0 | 0 | 0 | 29 |
| 30 | 2.0 | -3.3 | -7.5 | 4.7 | 6.6 | 0.0 | CALM | 0.1 | 9 | 0 | 1028.4 | 95.0 | -1.2 | 0 | 0 | 0 | 0 | 0 | 0 | 30 |
| 31 | 0.6 | -3.0 | -3.1 | 3.9 | 0.0 | 0.0 | CALM | 0.5 | 9 | 8 | 1026.8 | 97.4 | -0.8 | 0 | 0 | 0 | 0 | 0 | 0 | 31 |
| Total/Mean | 6.1 | 1.8 | -0.1 | 5.3 | 88.5 | 22.2 | X | 4.6 | X | 5.1 | 1015.6 | 94.9 | 3.6 | 0 | 0 | 0 | 0 | 0 | 0 | Total/Mean |
| *Diff./% | -1.0 | -1.2 | 186% | 42% | *Diff./% | |||||||||||||||
| Date | Max. Temp. (°C) 09/09h | Min. Temp. (°C) 09/09h | Grass Min. Temp. (°C) 21/09h | Earth (30cms) Temp. (°C) 09h | Sun (Hours) 00/00h | R'fall (MM) 09/09h | Wind Dir'n 09h | Mean Wind Speed (MPH) 00/00h | Max. Gust Speed (MPH) 00/00h | Cloud Cover (Oktas) 09h | Mean MSL Air Pressure (mB) 00/00h | Mean Rel. Humd. (%) 00/00h | Mean Temp. (°C) 00/00h | Fog (vis. <1000m @ 09h) | Fog (vis. <200m @ 09h) | Snow or Rain and Snow 00/00h | Snow Lying @ 09h (>50% cover) | Hail 00/00h | Thunder 00/00h | Date |
Differences from average:
Differences from average shown in red. Reference periods used are as follows: Temperature 30 Years 1976/2005; rainfall 30 Years 1971/2000; sunshine 30 Years 1971/2000.
(*The differences from average quoted during the course of the month relate to the cumulative daily averages up to the date of the last observation, not the averages for the month as a whole)
Additional Data:
Rainfall Duration 26.0 hours
Air Frost Duration 83.4 hours
Graphs and Charts:
Click on the following links to view this month's graphs and charts.....
1. Daily Maximum, Minimum & Grass Minimum Temperatures
2. Daily Maximum & Minimum Temperatures (with 30 Year Comparative Means)
3. Daily Earth (30 cms Depth) Temperature @ 0900 GMT 4. Daily Rainfall 5. Daily Sunshine
6. Daily Maximum Gust & Mean Wind Speed 7. Daily Wind Direction @ 0900 GMT
8. Daily Mean MSL Air Pressure 9. Daily Mean Relative Humidity 10. Thermograph
11. Barograph 12. Hygrograph 13. Anemograph 14. Wind Direction
15. Sunshine Duration 16. Rainfall Intensity & Duration
December 2008 Weather Review:
......and click on the link below for a text report of the December 2008 weather in Royston
December (since 1972) at Royston (Iceni) Weather Station:
Mean day maximum temperature (30 years 1976/2005) 7.1°C
Mean night minimum temperature (30 years 1976/2005) 3.0°C
Highest temperature 15.1°C (2nd December 1985); lowest temperature -9.8°C (29th December 1995)
Lowest grass minimum temperature -14.6°C (13th December 1981)
Warmest December 1974 (Mean temperature 7.8°C); coldest December 1981 (Mean temperature 0.4°C)
Average December rainfall (30 years 1971/2000) 52.8 mm
Wettest December 1989 (Rainfall 122.4 mm); driest December 1991 (Rainfall 10.3 mm)
Wettest Day 27th December 1979 (Rainfall 31.5 mm);
Highest number of "rain days" (0.2 mm or more) 22 (1978); lowest number of "rain days" 7 (2004)
Highest number of days with thunder 3 (1989)
Highest number of air frosts 20 (1981)
Highest number of ground frosts 25 (1981)
Highest number of days with snow falling 10 (1981)
Highest number of days with snow lying (ground with more than 50% snow cover @ 0900 GMT) 23 (1981)
|
|
|
|
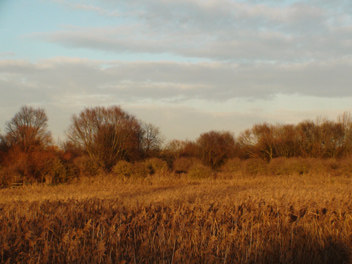
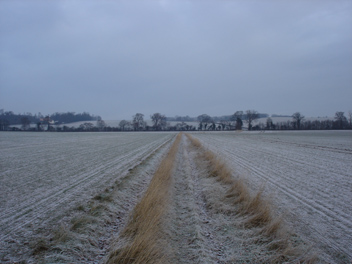
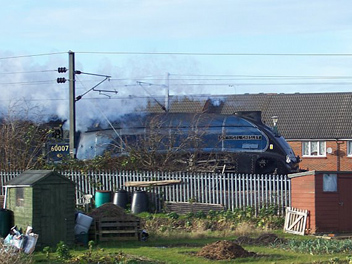
| This view is of Woodston Ponds, Peterborough (56 km NNW of Royston (Iceni) Weather Station), a nature reserve created out of old industrial settling ponds. Birds which have colonised the reserve include heron, kingfisher and reed bunting, whilst other species present are great crested newts and banded demoiselles. The river Nene runs alongside the reserve which in this picture is as seen on 10th December 2008 at 1458 GMT. The late afternoon sunshine has given the whole area an attractive golden brown hue. This was a cold but mainly sunny day and at Royston a maximum temperature of 4.0°C was achieved after an overnight minimum of -1.5°C, whilst sunshine of 6.8 hours was recorded. | A distinct coating of frost here covers the landscape on the morning of 12th December 2008 (at 0918 GMT). The location is at Lowerfield about 2.5 km E of Royston and the view is looking northwards towards the A505 trunk road (first line of trees) and beyond that to the ridge of higher ground which extends north-eastwards from Hyde Hill several hundred metres to Goffers Knoll. A little further north lies the flatter South Cambridgeshire Plain and the village of Melbourn. The weather at this time was rather cold with a SSW wind of mean speed 4 knots gusting to 14 knots in a temperature of -0.7C (after an overnight min. of -2.0°C). However, the max. temp. for the day was average at 7.6°C. | On 20th December 2008 the historic locomotive 60007 Sir Nigel Gresley passed through Royston hauling the 'Cathedrals Express Carol Concert' train from London Kings Cross to Norwich. This locomotive has the distinction of being the post war steam record holder, having achieved a speed of 112 mph on 23rd May 1959. Here the locomotive is seen under the overhead electric wires passing the allotment site at Coombes Hole near the northern boundary of the town. This was a very mild winter's day with the temperature rising to 13.1°C after an overnight minimum as high as 10.1°C, these values being 6.4°C and 7.7°C respectively above their 30 Year (1976/2005) means for this day! |
Return to Welcome to Royston (Iceni) Weather Station page
(This page last updated 12th January 2009 2057 GMT)