Royston (Iceni) Weather Station
Daily Weather Observations - January 2010
(All Times GMT)
| Date | Max. Temp. (°C) 09/09h | Min. Temp. (°C) 09/09h | Grass Min. Temp. (°C) 21/09h | Earth (30cms) Temp. (°C) 09h | Sun (Hours) 00/00h | R'fall (MM) 09/09h | Wind Dir'n 09h | Mean Wind Speed (MPH) 00/00h | Max. Gust Speed (MPH) 00/00h | Cloud Cover (Oktas) 09h | Mean MSL Air Pressure (mB) 00/00h | Mean Rel. Humd. (%) 00/00h | Mean Temp. (°C) 00/00h | Fog (vis. <1000m @ 09h) | Fog (vis. <200m @ 09h) | Snow or Rain and Snow 00/00h | Snow Lying @ 09h (>50% cover) | Hail 00/00h | Thunder 00/00h | Date |
| 1 | 1.4 | -2.6 | -6.5 | 3.9 | 6.7 | TR | N | 3.9 | 15 | 1 | 1005.3 | 88.7 | -1.0 | 0 | 0 | 1 | 0 | 0 | 0 | 1 |
| 2 | 3.3 | -1.0 | -3.5 | 3.3 | 5.2 | 0.5 | W | 6.4 | 21 | 0 | 1014.3 | 86.2 | 1.0 | 0 | 0 | 1 | 0 | 0 | 0 | 2 |
| 3 | 2.0 | -2.6 | -6.6 | 3.0 | 6.6 | 0.0 | NE | 1.2 | 10 | 0 | 1023.0 | 89.9 | -1.4 | 0 | 0 | 0 | 0 | 0 | 0 | 3 |
| 4 | 0.0 | -4.8 | -8.5 | 2.8 | 6.7 | 0.0 | W | 4.9 | 15 | 1 | 1018.3 | 89.2 | -2.9 | 0 | 0 | 0 | 0 | 0 | 0 | 4 |
| 5 | 2.5 | -2.6 | -5.3 | 2.5 | 3.2 | 0.4 | SW | 5.8 | 18 | 8 | 1003.9 | 81.3 | -0.6 | 0 | 0 | 1 | 0 | 0 | 0 | 5 |
| 6 | 0.1 | -2.5 | -3.3 | 2.4 | 0.0 | 1.3 | NE | 3.0 | 17 | 8 | 1003.7 | 88.9 | -2.0 | 0 | 0 | 1 | 1 | 0 | 0 | 6 |
| 7 | 0.0 | -6.5 | -12.6 | 2.2 | 0.8 | 0.3 | W | 6.3 | 21 | 7 | 1011.0 | 88.9 | -2.9 | 0 | 0 | 1 | 1 | 0 | 0 | 7 |
| 8 | 0.0 | -5.5 | -11.6 | 2.1 | 2.2 | 0.3 | NW | 2.4 | 12 | 8 | 1022.2 | 90.5 | -3.1 | 0 | 0 | 1 | 1 | 0 | 0 | 8 |
| 9 | 0.9 | -7.2 | -13.3 | 2.0 | 2.6 | 0.1 | NE | 5.2 | 20 | 2 | 1024.0 | 86.4 | -3.1 | 0 | 0 | 1 | 1 | 0 | 0 | 9 |
| 10 | 1.1 | -0.5 | -1.3 | 2.0 | 0.0 | 0.8 | NE | 6.5 | 19 | 8 | 1018.6 | 88.6 | 0.7 | 0 | 0 | 1 | 1 | 0 | 0 | 10 |
| 11 | 1.0 | -0.1 | -0.6 | 2.0 | 0.0 | 0.1 | NE | 1.4 | 10 | 8 | 1018.9 | 93.0 | 0.4 | 0 | 0 | 0 | 1 | 0 | 0 | 11 |
| 12 | 1.1 | 0.0 | -0.4 | 2.0 | 0.1 | 0.2 | SE | 3.1 | 20 | 8 | 1009.3 | 89.9 | 0.6 | 0 | 0 | 1 | 1 | 0 | 0 | 12 |
| 13 | 0.7 | 0.1 | -0.4 | 2.0 | 0.0 | 2.1 | E | 1.1 | 12 | 8 | 1000.5 | 88.6 | 0.3 | 0 | 0 | 1 | 1 | 0 | 0 | 13 |
| 14 | 2.1 | -0.5 | -1.6 | 2.0 | 0.0 | 9.2 | E | 0.8 | 6 | 8 | 1005.0 | 94.5 | 1.2 | 0 | 0 | 1 | 1 | 0 | 0 | 14 |
| 15 | 5.3 | -0.2 | -0.5 | 2.1 | 0.0 | 2.5 | S | 7.5 | 25 | 8 | 1016.2 | 94.9 | 2.8 | 0 | 0 | 0 | 0 | 0 | 0 | 15 |
| 16 | 7.2 | 2.4 | 1.9 | 2.5 | 0.0 | 3.4 | SE | 9.8 | 31 | 8 | 1005.4 | 92.1 | 4.8 | 0 | 0 | 0 | 0 | 0 | 0 | 16 |
| 17 | 7.7 | 3.0 | 1.0 | 3.4 | 5.5 | 0.0 | SW | 8.2 | 21 | 0 | 1015.2 | 87.4 | 5.2 | 0 | 0 | 0 | 0 | 0 | 0 | 17 |
| 18 | 8.4 | 4.0 | 2.2 | 3.4 | 4.4 | 0.0 | SW | 6.8 | 19 | 1 | 1023.6 | 89.4 | 6.4 | 0 | 0 | 0 | 0 | 0 | 0 | 18 |
| 19 | 6.9 | 5.3 | 3.8 | 4.0 | 0.0 | 0.0 | E | 2.4 | 15 | 8 | 1021.1 | 89.8 | 5.5 | 0 | 0 | 0 | 0 | 0 | 0 | 19 |
| 20 | 3.7 | 2.5 | 1.3 | 4.3 | 0.0 | 0.0 | E | 3.2 | 18 | 8 | 1012.3 | 86.0 | 3.1 | 0 | 0 | 0 | 0 | 0 | 0 | 20 |
| 21 | 6.0 | 1.5 | -0.1 | 4.1 | 1.2 | 1.6 | SE | 3.0 | 21 | 8 | 1018.8 | 85.4 | 2.7 | 0 | 0 | 0 | 0 | 0 | 0 | 21 |
| 22 | 7.5 | 2.1 | 1.1 | 4.1 | 0.0 | 5.0 | SE | 8.0 | 27 | 8 | 1016.4 | 93.0 | 6.1 | 0 | 0 | 0 | 0 | 0 | 0 | 22 |
| 23 | 5.5 | 5.0 | 4.8 | 4.8 | 0.0 | 0.0 | NW | 3.6 | 15 | 8 | 1019.8 | 91.4 | 5.0 | 0 | 0 | 0 | 0 | 0 | 0 | 23 |
| 24 | 5.1 | 2.4 | -0.8 | 4.9 | 0.3 | 5.0 | W | 3.8 | 12 | 8 | 1023.3 | 90.8 | 3.8 | 0 | 0 | 0 | 0 | 0 | 0 | 24 |
| 25 | 3.5 | 2.5 | 2.2 | 4.8 | 0.0 | TR | NE | 3.8 | 16 | 8 | 1031.2 | 90.8 | 2.7 | 0 | 0 | 0 | 0 | 0 | 0 | 25 |
| 26 | 2.3 | -0.4 | -1.5 | 4.6 | 4.9 | 0.0 | NE | 3.2 | 15 | 8 | 1040.4 | 82.2 | 0.3 | 0 | 0 | 0 | 0 | 0 | 0 | 26 |
| 27 | 6.1 | -3.0 | -7.0 | 4.0 | 0.0 | 0.9 | SW | 8.0 | 27 | 8 | 1028.0 | 86.5 | 2.0 | 0 | 0 | 0 | 0 | 0 | 0 | 27 |
| 28 | 6.5 | 2.4 | -0.1 | 4.0 | 2.5 | 4.8 | W | 7.7 | 20 | 8 | 1010.9 | 85.5 | 4.4 | 0 | 0 | 0 | 0 | 0 | 0 | 28 |
| 29 | 4.0 | 3.0 | 2.4 | 4.4 | 1.5 | 0.2 | NW | 8.4 | 29 | 8 | 992.6 | 82.3 | 2.4 | 0 | 0 | 0 | 0 | 0 | 0 | 29 |
| 30 | 3.5 | -2.7 | -5.5 | 4.0 | 7.2 | 0.0 | NW | 6.7 | 19 | 0 | 999.5 | 79.4 | -0.8 | 0 | 0 | 1 | 1 | 0 | 0 | 30 |
| 31 | 2.6 | -2.4 | -5.3 | 3.2 | 3.2 | TR | W | 7.0 | 19 | 6 | 1004.5 | 83.6 | -0.2 | 0 | 0 | 1 | 0 | 0 | 0 | 31 |
| Total/Mean | 3.5 | -0.3 | -2.4 | 3.3 | 64.8 | 38.7 | X | 4.9 | X | 6.0 | 1014.7 | 88.2 | 1.4 | 0 | 0 | 13 | 10 | 0 | 0 | Total/Mean |
| *Diff./% | -3.1 | -2.4 | 117% | 76% | *Diff./% | |||||||||||||||
| Date | Max. Temp. (°C) 09/09h | Min. Temp. (°C) 09/09h | Grass Min. Temp. (°C) 21/09h | Earth (30cms) Temp. (°C) 09h | Sun (Hours) 00/00h | R'fall (MM) 09/09h | Wind Dir'n 09h | Mean Wind Speed (MPH) 00/00h | Max. Gust Speed (MPH) 00/00h | Cloud Cover (Oktas) 09h | Mean MSL Air Pressure (mB) 00/00h | Mean Rel. Humd. (%) 00/00h | Mean Temp. (°C) 00/00h | Fog (vis. <1000m @ 09h) | Fog (vis. <200m @ 09h) | Snow or Rain and Snow 00/00h | Snow Lying @ 09h (>50% cover) | Hail 00/00h | Thunder 00/00h | Date |
Differences from average:
Differences from average shown in red. Reference periods used are as follows: Temperature 30 Years 1976/2005; rainfall 30 Years 1971/2000; sunshine 30 Years 1971/2000.
(*The differences from average quoted during the course of the month relate to the cumulative daily averages up to the date of the last observation, not the averages for the month as a whole)
Additional Data:
Rainfall Duration 45.7 hours
Air Frost Duration 252.4 hours
Graphs and Charts:
Click on the following links to view this month's graphs and charts.....
1. Daily Maximum, Minimum & Grass Minimum Temperatures
2. Daily Maximum & Minimum Temperatures (with 30 Year Comparative Means)
3. Daily Earth (30 cms Depth) Temperature @ 0900 GMT 4. Daily Rainfall 5. Daily Sunshine
6. Daily Maximum Gust & Mean Wind Speed 7. Daily Wind Direction @ 0900 GMT
8. Daily Mean MSL Air Pressure 9. Daily Mean Relative Humidity 10. Thermograph
11. Barograph 12. Hygrograph 13. Anemograph 14. Wind Direction
15. Sunshine Duration 16. Rainfall Intensity & Duration
January 2010 Weather Review:
......and click on the link below for a text report of the January 2010 weather in Royston
January (since 1973) at Royston (Iceni) Weather Station:
Mean day maximum temperature (30 years 1976/2005) 6.6°C
Mean night minimum temperature (30 years 1976/2005) 2.1°C
Highest temperature 14.2°C (6th January 1999); lowest temperature -12.7°C (14th January 1982)
Lowest grass minimum temperature -18.1°C (10th January 1982)
Warmest January 2007, 2008 (Mean temperature 7.4°C); coldest January 1979 (Mean temperature 0.1°C)
Average January rainfall (30 years 1971/2000) 51.2 mm
Wettest January 1995 (Rainfall 108.2 mm); driest January 1987 (Rainfall 9.6 mm)
Wettest Day 9th January 1992 (Rainfall 25.1 mm);
Highest number of "rain days" (0.2 mm or more) 25 (1988, 2004); lowest number of "rain days" 9 (1992)
Highest number of days with thunder 1 (1974, 1984. 1988, 1994, 1998 and 2004)
Highest number of air frosts 20 (1979, 1985)
Highest number of ground frosts 25 (1979)
Highest number of days with snow falling 15 (1985)
Highest number of days with snow lying (ground with more than 50% snow cover @ 0900 GMT) 17 (1985)
|
|
|
|
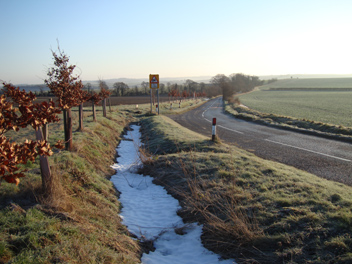
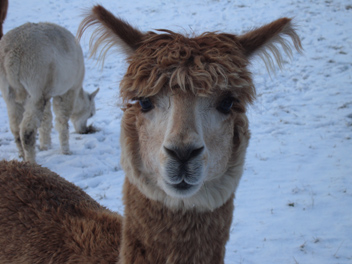
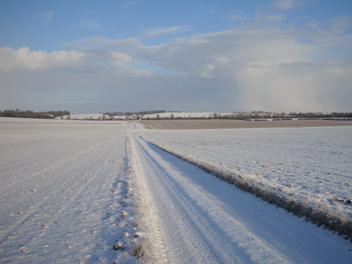
| A few patches of the mid-December snowfall still survived in the district around Royston on 3rd January 2010 when this picture was taken (at 0933 GMT). This is the B1039 road near Eagle Tavern, Royston looking eastwards towards Barley and Great Chishill. Although the temperature is -2.8°C (and after an overnight grass minimum temperature of -6.6°C) there is very little visible frost, whereas at this time on the following day (4th) this scene was completely white with frost! The clear sky heralded a sunny day (6.6 hours) and the temperature later rose to a maximum of 2.0°C. This snow was covered by a fresh layer on 6th and even more on 7th. | The flock of alpacas in Barkway Road, Royston seem quite content in the snow after further falls of snow in Royston on 6th and 7th January 2010, no doubt being used to such conditions in their native Andean habitats. Apparently the snow does not penetrate the wool of the alpaca (although rain does!) so they are able to resist this form of precipitation with ease. The camelid above (as seen on 8th January 2010 at 1443 GMT) stepped forward from the flock to have its photograph taken but curiously shortly afterwards put its ears down and would not put them up again, despite most of the others having their ears up! | This view from Poorsland about 2.5 km SE of Royston is typical of the 'big sky' country around Royston, and is looking northwards towards Hyde Hill in the distance and the South Cambridgeshire Plain beyond. A snow shower can be seen developing on the northern horizon and moving towards this location where a brief but heavy snow shower occurred just 20 minutes later. Various amounts of light to moderate snowfall occurred in Royston every day from 5th to 14th January 2010 (except 11th), this photograph being taken on 9th at 0941 GMT. The temperature at this time was -4.9°C in a NNE wind of mean speed 4 knots gusting to 8 knots. |
Return to Welcome to Royston (Iceni) Weather Station page
(This page last updated 11th February 2010 2111 GMT)