Royston (Iceni) Weather Station
Daily Weather Observations - June 2010
(All Times GMT)
| Date | Max. Temp. (°C) 09/09h | Min. Temp. (°C) 09/09h | Grass Min. Temp. (°C) 21/09h | Earth (30cms) Temp. (°C) 09h | Sun (Hours) 00/00h | R'fall (MM) 09/09h | Wind Dir'n 09h | Mean Wind Speed (MPH) 00/00h | Max. Gust Speed (MPH) 00/00h | Cloud Cover (Oktas) 09h | Mean MSL Air Pressure (mB) 00/00h | Mean Rel. Humd. (%) 00/00h | Mean Temp. (°C) 00/00h | Fog (vis. <1000m @ 09h) | Fog (vis. <200m @ 09h) | Snow or Rain and Snow 00/00h | Snow Lying @ 09h (>50% cover) | Hail 00/00h | Thunder 00/00h | Date |
| 1 | 14.1 | 9.0 | 6.6 | 15.0 | 0.0 | 3.2 | S | 2.3 | 12 | 8 | 1016.6 | 87.8 | 12.0 | 0 | 0 | 0 | 0 | 0 | 0 | 1 |
| 2 | 22.1 | 7.5 | 4.9 | 14.7 | 11.8 | 0.0 | N | 2.8 | 12 | 1 | 1021.7 | 70.4 | 14.4 | 0 | 0 | 0 | 0 | 0 | 0 | 2 |
| 3 | 23.1 | 7.1 | 3.5 | 15.9 | 16.0 | 0.0 | E | 1.9 | 16 | 0 | 1022.6 | 58.5 | 15.4 | 0 | 0 | 0 | 0 | 0 | 0 | 3 |
| 4 | 25.5 | 8.7 | 5.2 | 16.3 | 15.3 | 0.0 | SE | 3.1 | 14 | 0 | 1020.1 | 65.2 | 17.1 | 0 | 0 | 0 | 0 | 0 | 0 | 4 |
| 5 | 26.2 | 12.0 | 8.6 | 17.4 | 7.1 | 2.3 | E | 3.4 | 16 | 2 | 1017.0 | 65.2 | 19.1 | 0 | 0 | 0 | 0 | 0 | 0 | 5 |
| 6 | 22.8 | 15.3 | 13.9 | 17.6 | 1.5 | 22.3 | S | 4.9 | 22 | 8 | 1010.6 | 84.0 | 16.9 | 0 | 0 | 0 | 0 | 0 | 1 | 6 |
| 7 | 19.5 | 11.3 | 9.3 | 17.3 | 1.5 | 6.7 | W | 5.4 | 20 | 5 | 1009.8 | 77.3 | 15.1 | 0 | 0 | 0 | 0 | 0 | 0 | 7 |
| 8 | 19.0 | 11.4 | 11.0 | 17.1 | 1.7 | 0.4 | SE | 4.2 | 19 | 8 | 1001.5 | 83.1 | 14.9 | 0 | 0 | 0 | 0 | 0 | 0 | 8 |
| 9 | 19.1 | 11.9 | 10.0 | 16.9 | 0.5 | 3.7 | S | 2.8 | 15 | 8 | 1004.3 | 85.1 | 15.0 | 0 | 0 | 0 | 0 | 0 | 0 | 9 |
| 10 | 17.8 | 13.0 | 10.7 | 16.9 | 0.1 | 1.9 | NE | 7.0 | 25 | 8 | 1007.6 | 89.1 | 14.3 | 0 | 0 | 0 | 0 | 0 | 0 | 10 |
| 11 | 18.7 | 11.5 | 11.7 | 16.4 | 3.9 | 0.0 | NW | 4.1 | 18 | 8 | 1008.8 | 82.5 | 14.1 | 0 | 0 | 0 | 0 | 0 | 0 | 11 |
| 12 | 19.0 | 8.7 | 5.4 | 15.9 | 4.6 | 0.0 | N | 4.2 | 16 | 8 | 1015.1 | 74.7 | 13.6 | 0 | 0 | 0 | 0 | 0 | 0 | 12 |
| 13 | 20.8 | 10.6 | 9.4 | 16.0 | 1.8 | 0.7 | SW | 5.9 | 20 | 7 | 1013.9 | 72.5 | 15.1 | 0 | 0 | 0 | 0 | 0 | 0 | 13 |
| 14 | 19.3 | 10.3 | 7.1 | 16.4 | 1.4 | 0.0 | NE | 4.4 | 22 | 5 | 1017.8 | 81.9 | 13.3 | 0 | 0 | 0 | 0 | 0 | 0 | 14 |
| 15 | 18.1 | 5.6 | 2.7 | 16.1 | 9.9 | 0.0 | NE | 4.8 | 23 | 6 | 1027.5 | 71.1 | 11.8 | 0 | 0 | 0 | 0 | 0 | 0 | 15 |
| 16 | 20.0 | 5.1 | 2.5 | 16.0 | 11.7 | 0.0 | NE | 4.8 | 19 | 7 | 1025.6 | 70.3 | 12.6 | 0 | 0 | 0 | 0 | 0 | 0 | 16 |
| 17 | 22.7 | 4.6 | 1.6 | 16.3 | 14.6 | 0.0 | NE | 4.0 | 19 | 0 | 1022.2 | 73.2 | 13.8 | 0 | 0 | 0 | 0 | 0 | 0 | 17 |
| 18 | 16.9 | 9.0 | 6.0 | 17.1 | 0.1 | 0.4 | N | 3.1 | 16 | 8 | 1019.8 | 83.0 | 12.7 | 0 | 0 | 0 | 0 | 0 | 0 | 18 |
| 19 | 14.5 | 6.6 | 4.0 | 16.3 | 1.9 | 0.6 | N | 5.7 | 24 | 6 | 1016.9 | 75.2 | 10.6 | 0 | 0 | 0 | 0 | 0 | 0 | 19 |
| 20 | 17.8 | 6.0 | 3.6 | 15.8 | 4.3 | 0.0 | NW | 4.9 | 17 | 8 | 1020.4 | 68.5 | 12.1 | 0 | 0 | 0 | 0 | 0 | 0 | 20 |
| 21 | 24.6 | 11.1 | 8.0 | 15.9 | 9.2 | 0.0 | NW | 3.2 | 17 | 0 | 1022.4 | 66.2 | 17.1 | 0 | 0 | 0 | 0 | 0 | 0 | 21 |
| 22 | 26.9 | 12.2 | 10.7 | 17.1 | 14.6 | 0.0 | W | 5.8 | 17 | 1 | 1022.2 | 56.8 | 19.9 | 0 | 0 | 0 | 0 | 0 | 0 | 22 |
| 23 | 26.4 | 13.5 | 11.1 | 18.0 | 15.3 | 0.0 | NW | 4.7 | 18 | 1 | 1020.8 | 56.1 | 20.0 | 0 | 0 | 0 | 0 | 0 | 0 | 23 |
| 24 | 25.0 | 14.0 | 11.1 | 18.5 | 10.2 | 0.0 | W | 4.8 | 17 | 2 | 1018.3 | 60.6 | 19.4 | 0 | 0 | 0 | 0 | 0 | 0 | 24 |
| 25 | 25.5 | 12.0 | 8.9 | 18.8 | 8.4 | 0.0 | NW | 2.2 | 11 | 1 | 1017.1 | 66.7 | 18.9 | 0 | 0 | 0 | 0 | 0 | 0 | 25 |
| 26 | 25.7 | 14.6 | 13.8 | 19.4 | 8.5 | 0.0 | SE | 3.4 | 16 | 8 | 1016.7 | 66.2 | 19.5 | 0 | 0 | 0 | 0 | 0 | 0 | 26 |
| 27 | 29.5 | 14.4 | 11.1 | 19.4 | 14.7 | 0.0 | SW | 4.0 | 15 | 1 | 1017.3 | 57.7 | 21.7 | 0 | 0 | 0 | 0 | 0 | 0 | 27 |
| 28 | 27.7 | 13.9 | 10.7 | 20.0 | 14.9 | 0.1 | W | 5.0 | 19 | 0 | 1019.4 | 52.2 | 20.9 | 0 | 0 | 0 | 0 | 0 | 0 | 28 |
| 29 | 27.8 | 16.3 | 13.7 | 20.4 | 5.2 | 0.0 | W | 5.4 | 20 | 3 | 1017.7 | 61.0 | 21.2 | 0 | 0 | 0 | 0 | 0 | 0 | 29 |
| 30 | 25.5 | 16.0 | 12.5 | 20.4 | 6.5 | 0.0 | NW | 2.7 | 15 | 6 | 1017.3 | 62.3 | 20.1 | 0 | 0 | 0 | 0 | 0 | 0 | 30 |
| Total/Mean | 22.1 | 10.8 | 8.3 | 17.2 | 216.8 | 42.3 | X | 4.2 | X | 4.5 | 1017.0 | 70.8 | 16.1 | 0 | 0 | 0 | 0 | 0 | 1 | Total/Mean |
| *Diff./% | +2.2 | +0.2 | 120% | 84% | *Diff./% | |||||||||||||||
| Date | Max. Temp. (°C) 09/09h | Min. Temp. (°C) 09/09h | Grass Min. Temp. (°C) 21/09h | Earth (30cms) Temp. (°C) 09h | Sun (Hours) 00/00h | R'fall (MM) 09/09h | Wind Dir'n 09h | Mean Wind Speed (MPH) 00/00h | Max. Gust Speed (MPH) 00/00h | Cloud Cover (Oktas) 09h | Mean MSL Air Pressure (mB) 00/00h | Mean Rel. Humd. (%) 00/00h | Mean Temp. (°C) 00/00h | Fog (vis. <1000m @ 09h) | Fog (vis. <200m @ 09h) | Snow or Rain and Snow 00/00h | Snow Lying @ 09h (>50% cover) | Hail 00/00h | Thunder 00/00h | Date |
Differences from average:
Differences from average shown in red. Reference periods used are as follows: Temperature 30 Years 1976/2005; rainfall 30 Years 1971/2000; sunshine 30 Years 1971/2000.
(*The differences from average quoted during the course of the month relate to the cumulative daily averages up to the date of the last observation, not the averages for the month as a whole)
Additional Data:
Rainfall Duration N/A
Air Frost Duration NIL hours
Graphs and Charts:
Click on the following links to view this month's graphs and charts.....
1. Daily Maximum, Minimum & Grass Minimum Temperatures
2. Daily Maximum & Minimum Temperatures (with 30 Year Comparative Means)
3. Daily Earth (30 cms Depth) Temperature @ 0900 GMT 4. Daily Rainfall 5. Daily Sunshine
6. Daily Maximum Gust & Mean Wind Speed 7. Daily Wind Direction @ 0900 GMT
8. Daily Mean MSL Air Pressure 9. Daily Mean Relative Humidity 10. Thermograph
11. Barograph 12. Hygrograph 13. Anemograph 14. Wind Direction
15. Rainfall Intensity & Duration
June 2010 Weather Review:
......and click on the link below for a text report of the June 2010 weather in Royston
June (since 1972) at Royston (Iceni) Weather Station:
Mean daily maximum temperature (30 years 1976/2005) 19.9°C
Mean daily minimum temperature (30 years 1976/2005) 10.6°C
Highest temperature 33.7°C (26th June 1976); lowest temperature 2.2°C (3rd June 1975)
Lowest grass minimum temperature -1.0°C (2nd June 1991)
Warmest June 1976 (Mean temperature 18.3°C); coldest June 1977 (Mean temperature 12.5°C)
Average June rainfall (30 years 1971/2000) 50.2 mm
Wettest June 1985 (Rainfall 135.4 mm); driest June 1996 (Rainfall 8.0 mm)
Wettest Day 19th June 1973 (Rainfall 36.8 mm);
Highest number of "rain days" (0.2 mm or more) 23 (1997); lowest number of "rain days" 3 (1976, 1996)
Highest number of days with thunder 10 (1982)
Highest number of air frosts 0
Highest number of ground frosts 2 (1989)
Highest number of days with snow falling 1 (1975)
Highest number of days with snow lying (ground with more than 50% snow cover @ 0900 GMT) 0
|
|
|
|
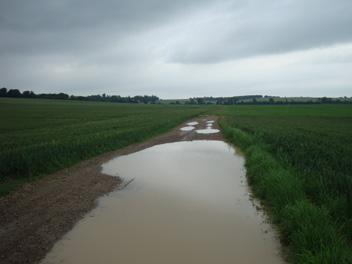
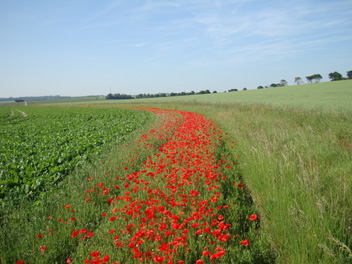
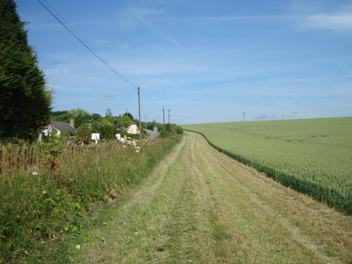
| This partially flooded farm track near Royston hardly presents a credible picture for June 2010 as it has been a seemingly dry month contributing to the dusty conditions towards the end of the month. However, a band of heavy showers moving eastwards across the area in the afternoon of 6th yielded rainfall of 22.3 millimetres, followed by a further 6.7 millimetres rainfall the following day. This picture was taken on 8th at 0749 GMT under cloudy skies in a temperature of 13.6°C. The temperature later reached a maximum of 19.0°C for the day but only 1.7 hours sunshine was recorded. | An acreage of beet sugar at Lowerfield some 2 km E of Royston took on an attractive border towards the end of June 2010 with the poppies coming into bloom as seen in the above photograph (taken at 0737 GMT on 23rd). The largely clear sky is indicative of the anticyclonic conditions which have settled over the country. A light NNW breeze of mean speed 1 knot gusting to 4 knots is drifting across the landscape and the temperature is 18.5°C, later rising to a maximum of 26.4°C. The fine day in prospect accumulated a sunshine total of 15.3 hours. | A recent innovation on the Burloes estate to the SE of Royston is the creation of a grass border around the western edge of the estate which doubles as a refuge for wildlife and as a permissive way for walkers and horse riders. In the above picture the border is here running parallel to the B1039 Barkway Road as viewed up the hill towards Royston. A similar border is already in existence to the S and E of the estate. This photograph was taken on 24th June 2010 at 0816 GMT. The temperature is 16.8°C and rising rapidly (to a maximum of 25.0°C) whilst total sunshine for the day was 10.2 hours. |
Return to Welcome to Royston (Iceni) Weather Station page
(This page last updated 9th July 2010 2012 GMT)