Royston (Iceni) Weather Station
Daily Weather Observations - July 2010
(All Times GMT)
| Date | Max. Temp. (°C) 09/09h | Min. Temp. (°C) 09/09h | Grass Min. Temp. (°C) 21/09h | Earth (30cms) Temp. (°C) 09h | Sun (Hours) 00/00h | R'fall (MM) 09/09h | Wind Dir'n 09h | Mean Wind Speed (MPH) 00/00h | Max. Gust Speed (MPH) 00/00h | Cloud Cover (Oktas) 09h | Mean MSL Air Pressure (mB) 00/00h | Mean Rel. Humd. (%) 00/00h | Mean Temp. (°C) 00/00h | Fog (vis. <1000m @ 09h) | Fog (vis. <200m @ 09h) | Snow or Rain and Snow 00/00h | Snow Lying @ 09h (>50% cover) | Hail 00/00h | Thunder 00/00h | Date |
| 1 | 25.9 | 14.0 | 12.8 | 20.3 | 4.8 | 0.0 | SW | 7.1 | 23 | 4 | 1011.9 | 63.4 | 20.2 | 0 | 0 | 0 | 0 | 0 | 0 | 1 |
| 2 | 25.5 | 18.0 | 16.0 | 20.5 | 3.6 | 0.1 | SW | 6.6 | 26 | 8 | 1010.7 | 66.4 | 21.3 | 0 | 0 | 0 | 0 | 0 | 0 | 2 |
| 3 | 26.1 | 14.7 | 12.0 | 20.5 | 12.1 | 0.0 | W | 5.4 | 18 | 2 | 1017.9 | 57.5 | 19.8 | 0 | 0 | 0 | 0 | 0 | 0 | 3 |
| 4 | 24.7 | 13.4 | 10.7 | 20.4 | 10.5 | 0.0 | SW | 9.0 | 27 | 1 | 1018.3 | 61.0 | 18.8 | 0 | 0 | 0 | 0 | 0 | 0 | 4 |
| 5 | 24.2 | 13.4 | 11.3 | 20.4 | 4.5 | 0.0 | NW | 5.7 | 20 | 6 | 1020.5 | 63.0 | 17.6 | 0 | 0 | 0 | 0 | 0 | 0 | 5 |
| 6 | 23.0 | 10.0 | 6.6 | 20.0 | 4.9 | 0.0 | NW | 4.6 | 17 | 5 | 1023.7 | 56.8 | 17.0 | 0 | 0 | 0 | 0 | 0 | 0 | 6 |
| 7 | 23.0 | 14.4 | 13.6 | 19.6 | 1.0 | 0.4 | SW | 8.2 | 26 | 7 | 1018.0 | 73.2 | 18.6 | 0 | 0 | 0 | 0 | 0 | 0 | 7 |
| 8 | 25.6 | 16.4 | 16.2 | 19.5 | 4.7 | 0.0 | SW | 4.5 | 19 | 8 | 1016.9 | 67.5 | 20.5 | 0 | 0 | 0 | 0 | 0 | 0 | 8 |
| 9 | 31.3 | 15.1 | 13.6 | 19.9 | 12.9 | 0.0 | W | 5.4 | 18 | 6 | 1015.3 | 58.4 | 22.9 | 0 | 0 | 0 | 0 | 0 | 0 | 9 |
| 10 | 29.6 | 17.3 | 15.1 | 20.7 | 14.1 | 0.0 | S | 5.9 | 20 | 4 | 1015.9 | 60.1 | 23.0 | 0 | 0 | 0 | 0 | 0 | 0 | 10 |
| 11 | 27.3 | 16.8 | 15.5 | 21.1 | 9.5 | TR | SW | 7.6 | 25 | 5 | 1013.3 | 57.8 | 21.1 | 0 | 0 | 0 | 0 | 0 | 0 | 11 |
| 12 | 22.5 | 15.0 | 13.8 | 21.2 | 1.2 | 0.5 | SE | 4.4 | 20 | 8 | 1011.2 | 72.2 | 17.5 | 0 | 0 | 0 | 0 | 0 | 0 | 12 |
| 13 | 19.5 | 13.4 | 13.0 | 20.4 | 0.0 | 0.1 | NE | 2.5 | 13 | 8 | 1008.2 | 84.1 | 16.3 | 0 | 0 | 0 | 0 | 0 | 0 | 13 |
| 14 | 21.5 | 14.6 | 12.9 | 19.5 | 1.0 | 3.9 | S | 6.2 | 23 | 7 | 1001.7 | 75.2 | 18.0 | 0 | 0 | 0 | 0 | 0 | 0 | 14 |
| 15 | 21.3 | 14.4 | 13.1 | 19.0 | 7.6 | 1.4 | SW | 12.9 | 37 | 3 | 1002.6 | 70.4 | 17.7 | 0 | 0 | 0 | 0 | 0 | 0 | 15 |
| 16 | 22.3 | 12.7 | 11.3 | 18.9 | 9.0 | 0.5 | SW | 12.1 | 37 | 2 | 1007.4 | 70.3 | 17.3 | 0 | 0 | 0 | 0 | 0 | 0 | 16 |
| 17 | 21.3 | 13.0 | 11.7 | 18.8 | 4.8 | 0.0 | SW | 7.8 | 23 | 4 | 1017.9 | 63.6 | 16.4 | 0 | 0 | 0 | 0 | 0 | 0 | 17 |
| 18 | 25.1 | 10.8 | 9.4 | 18.5 | 5.7 | 0.0 | SW | 8.1 | 25 | 8 | 1023.6 | 64.4 | 18.1 | 0 | 0 | 0 | 0 | 0 | 0 | 18 |
| 19 | 29.0 | 15.0 | 14.1 | 18.9 | 8.4 | 0.0 | SW | 6.7 | 22 | 4 | 1019.5 | 51.6 | 21.6 | 0 | 0 | 0 | 0 | 0 | 0 | 19 |
| 20 | 28.1 | 17.4 | 16.6 | 19.7 | 0.4 | 0.0 | S | 4.8 | 18 | 8 | 1009.9 | 48.2 | 22.5 | 0 | 0 | 0 | 0 | 0 | 0 | 20 |
| 21 | 25.4 | 16.8 | 15.2 | 20.0 | 11.5 | 0.0 | SW | 7.6 | 26 | 1 | 1004.9 | 57.2 | 20.1 | 0 | 0 | 0 | 0 | 0 | 0 | 21 |
| 22 | 23.0 | 12.6 | 11.0 | 19.9 | 6.8 | 1.3 | S | 4.5 | 18 | 3 | 1011.3 | 75.4 | 16.7 | 0 | 0 | 0 | 0 | 0 | 1 | 22 |
| 23 | 21.2 | 13.0 | 12.1 | 19.5 | 1.2 | 0.0 | N | 2.9 | 16 | 7 | 1019.9 | 72.4 | 15.7 | 0 | 0 | 0 | 0 | 0 | 0 | 23 |
| 24 | 25.6 | 13.0 | 9.2 | 18.9 | 9.2 | 0.0 | SW | 6.0 | 20 | 3 | 1020.9 | 59.8 | 19.0 | 0 | 0 | 0 | 0 | 0 | 0 | 24 |
| 25 | 27.7 | 15.7 | 14.6 | 19.5 | 2.3 | 0.2 | W | 6.1 | 19 | 8 | 1016.0 | 64.4 | 20.0 | 0 | 0 | 0 | 0 | 0 | 0 | 25 |
| 26 | 23.0 | 16.3 | 15.5 | 20.0 | 0.1 | 0.9 | NW | 4.8 | 19 | 8 | 1015.7 | 80.0 | 18.5 | 0 | 0 | 0 | 0 | 0 | 0 | 26 |
| 27 | 22.0 | 16.5 | 14.5 | 19.8 | 1.1 | 6.8 | W | 3.9 | 15 | 8 | 1016.1 | 83.4 | 19.3 | 0 | 0 | 0 | 0 | 0 | 0 | 27 |
| 28 | 24.3 | 13.1 | 11.0 | 19.3 | 7.1 | 0.0 | W | 6.0 | 23 | 2 | 1015.9 | 68.0 | 17.7 | 0 | 0 | 0 | 0 | 0 | 0 | 28 |
| 29 | 20.4 | 11.4 | 9.1 | 19.3 | 2.5 | 0.0 | NW | 5.8 | 19 | 6 | 1015.0 | 71.2 | 15.9 | 0 | 0 | 0 | 0 | 0 | 0 | 29 |
| 30 | 22.0 | 10.9 | 8.7 | 18.5 | 1.1 | 2.7 | W | 5.2 | 18 | 5 | 1013.3 | 69.9 | 16.8 | 0 | 0 | 0 | 0 | 0 | 0 | 30 |
| 31 | 24.3 | 16.6 | 15.9 | 19.0 | 4.8 | 1.6 | NE | 5.9 | 21 | 8 | 1010.3 | 75.2 | 18.6 | 0 | 0 | 0 | 0 | 0 | 0 | 31 |
| Total/Mean | 24.4 | 14.4 | 12.8 | 19.7 | 168.2 | 20.4 | X | 6.3 | X | 5.4 | 1014.3 | 66.5 | 18.9 | 0 | 0 | 0 | 0 | 0 | 1 | Total/Mean |
| *Diff./% | +2.1 | +1.8 | 88% | 44% | *Diff./% | |||||||||||||||
| Date | Max. Temp. (°C) 09/09h | Min. Temp. (°C) 09/09h | Grass Min. Temp. (°C) 21/09h | Earth (30cms) Temp. (°C) 09h | Sun (Hours) 00/00h | R'fall (MM) 09/09h | Wind Dir'n 09h | Mean Wind Speed (MPH) 00/00h | Max. Gust Speed (MPH) 00/00h | Cloud Cover (Oktas) 09h | Mean MSL Air Pressure (mB) 00/00h | Mean Rel. Humd. (%) 00/00h | Mean Temp. (°C) 00/00h | Fog (vis. <1000m @ 09h) | Fog (vis. <200m @ 09h) | Snow or Rain and Snow 00/00h | Snow Lying @ 09h (>50% cover) | Hail 00/00h | Thunder 00/00h | Date |
Differences from average:
Differences from average shown in red. Reference periods used are as follows: Temperature 30 Years 1976/2005; rainfall 30 Years 1971/2000; sunshine 30 Years 1971/2000.
(*The differences from average quoted during the course of the month relate to the cumulative daily averages up to the date of the last observation, not the averages for the month as a whole)
Additional Data:
Rainfall Duration N/A
Air Frost Duration NIL hours
Graphs and Charts:
Click on the following links to view this month's graphs and charts.....
1. Daily Maximum, Minimum & Grass Minimum Temperatures
2. Daily Maximum & Minimum Temperatures (with 30 Year Comparative Means)
3. Daily Earth (30 cms Depth) Temperature @ 0900 GMT 4. Daily Rainfall 5. Daily Sunshine
6. Daily Maximum Gust & Mean Wind Speed 7. Daily Wind Direction @ 0900 GMT
8. Daily Mean MSL Air Pressure 9. Daily Mean Relative Humidity 10. Thermograph
11. Barograph 12. Hygrograph 13. Anemograph 14. Wind Direction
15. Rainfall Intensity & Duration
July 2010 Weather Review:
......and click on the link below for a text report of the July 2010 weather in Royston
July (since 1972) at Royston (Iceni) Weather Station:
Mean day maximum temperature (30 years 1976/2005) 22.3°C
Mean night minimum temperature (30 years 1976/2005) 12.6°C
Highest temperature 35.2°C (19th July 2006); lowest temperature 6.4°C (30th July 1977)
Lowest grass minimum temperature 2.8°C (13th July 1993)
Hottest July 2006 (Mean temperature 21.5°C); coolest July 1978 (Mean temperature 15.2°C)
Average July rainfall (30 years 1971/2000) 43.2 mm
Wettest July 2002 (Rainfall 104.7 mm); driest July 1984 (Rainfall 8.3 mm)
Wettest Day 26th July 2006 (Rainfall 75.5 mm);
Highest number of "rain days" (0.2 mm or more) 20 (1988); lowest number of "rain days" 6 (1976,1977, 1979, 1984, & 1990)
Highest number of days with thunder 6 (1975, 1982,1983 & 2002)
|
|
|
|
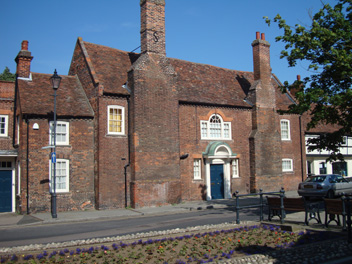
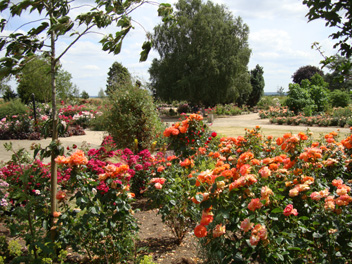
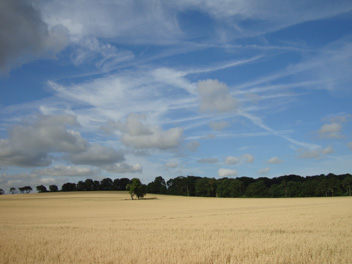
| This famous Royston landmark is King James Palace in Kneesworth Street, as photographed in the late afternoon sunshine on 28th June 2010. When King James VI of Scotland travelled south in 1603 to accede to the English throne (as James I) he is said to have stopped in Royston on the way, and duly impressed later set up court in the town to indulge in his passion for hunting. A number of other houses were built in the vicinity of the Palace to support the King and his court; the barely discernible building to the right of the picture housed the King's kitchens, and opposite is another building which accommodated the King's equerries. At the time of the photograph (1545 GMT) the temperature was 27.2°C, just short of the day's maximum of 27.7°C. A total of 14.9 hours sunshine was enjoyed in Royston on this day. | This is one of the many colourful views in the magnificent Garden of the Rose at the home of the Royal National Rose Society at Chiswell Green just to the SW of the city of St. Albans, and some 41 km to the SSW of Royston. After temporary closure several years ago the Garden was completely refurbished and re-opened with new roses on 9th June 2007. The gardens boast stunning displays of tens of thousands of roses, both old and modern, complemented by companion plants such as herbaceous perennials, spring bulbs, shrubs and grasses. On the day this photograph was taken (3rd July 2010 at 1331 GMT) the gardens had just experienced a very dry June as evidenced by the parched grass areas. This was followed by an equally dry July, thus delaying recovery of the grass to the normal lush green. | A combination of cumulus and cirrus clouds plus a number of aircraft contrails makes for an interesting sky over Royston in the early morning of 10th July 2010 (at 0744 GMT). This was the view from the Icknield Way at Lowerfield some 2.5 km E of Royston and features an acreage of oats approaching maturity. Harvesting of this crop commenced some 12 days later in what had been a very warm and dry July to date. The temperature at this time was already as high as 21.6°C, later rising to a maximum of 29.6°C. On the previous day the temperature had attained a maximum of 31.3°C, this being the first day to reach 30°C for 4 years (since 26th July 2006). The oats are gently swaying in a S wind of mean speed 5 knots gusting to 10 knots, and a sunshine total of 14.1 hours for the day undoubtedly assisted the ripening process of this crop. |
Return to Welcome to Royston (Iceni) Weather Station page
(This page last updated 9th August 2010 2018 GMT)