Royston (Iceni) Weather Station
Daily Weather Observations - December 2010
(All Times GMT)
| Date | Max. Temp. (°C) 09/09h | Min. Temp. (°C) 09/09h | Grass Min. Temp. (°C) 21/09h | Earth (30cms) Temp. (°C) 09h | Sun (Hours) 00/00h | R'fall (MM) 09/09h | Wind Dir'n 09h | Mean Wind Speed (MPH) 00/00h | Max. Gust Speed (MPH) 00/00h | Cloud Cover (Oktas) 09h | Mean MSL Air Pressure (mB) 00/00h | Mean Rel. Humd. (%) 00/00h | Mean Temp. (°C) 00/00h | Fog (vis. <1000m @ 09h) | Fog (vis. <200m @ 09h) | Snow or Rain and Snow 00/00h | Snow Lying @ 09h (>50% cover) | Hail 00/00h | Thunder 00/00h | Date |
| 1 | -0.3 | -5.4 | -10.1 | 3.4 | 2.1 | 0.3 | NE | 7.8 | 27 | 7 | 1008.2 | 75.0 | -2.0 | 0 | 0 | 1 | 1 | 0 | 0 | 1 |
| 2 | 0.0 | -1.8 | -2.4 | 3.3 | 0.1 | 0.0 | NE | 5.6 | 25 | 8 | 1008.2 | 82.5 | -1.6 | 0 | 0 | 1 | 1 | 0 | 0 | 2 |
| 3 | 2.2 | -5.6 | -10.4 | 3.2 | 0.1 | 0.9 | NW | 6.2 | 22 | 8 | 1010.4 | 89.8 | -3.0 | 0 | 0 | 0 | 1 | 0 | 0 | 3 |
| 4 | 4.1 | -3.0 | -4.5 | 3.1 | 0.1 | 1.6 | SW | 7.0 | 29 | 8 | 1003.3 | 91.8 | 2.5 | 0 | 0 | 1 | 1 | 0 | 0 | 4 |
| 5 | 2.0 | 0.0 | -0.6 | 3.2 | 2.2 | 0.0 | W | 5.1 | 16 | 8 | 1003.3 | 92.0 | 0.8 | 0 | 0 | 0 | 0 | 0 | 0 | 5 |
| 6 | -1.0 | -4.0 | -7.3 | 3.3 | 0.0 | 0.1 | NW | 1.9 | 9 | 8 | 1002.4 | 92.6 | -2.4 | 1 | 0 | 0 | 0 | 0 | 0 | 6 |
| 7 | -0.9 | -7.0 | -10.1 | 3.0 | 3.7 | TR | CALM | 0.7 | 6 | 1 | 1005.5 | 91.1 | -4.5 | 0 | 0 | 0 | 0 | 0 | 0 | 7 |
| 8 | 0.7 | -5.1 | -5.1 | 3.0 | 1.7 | 0.0 | N | 4.0 | 17 | 8 | 1013.1 | 90.6 | -1.2 | 1 | 0 | 1 | 0 | 0 | 0 | 8 |
| 9 | 4.1 | -4.0 | -7.0 | 2.8 | 6.1 | 0.0 | W | 8.0 | 20 | 1 | 1028.1 | 84.7 | -0.2 | 0 | 0 | 0 | 0 | 0 | 0 | 9 |
| 10 | 6.4 | 1.9 | -0.4 | 2.7 | 0.1 | 0.0 | W | 9.5 | 25 | 8 | 1029.4 | 88.1 | 4.7 | 0 | 0 | 0 | 0 | 0 | 0 | 10 |
| 11 | 8.0 | 4.8 | 1.8 | 2.9 | 5.0 | 0.0 | W | 6.2 | 23 | 1 | 1024.0 | 87.6 | 5.1 | 0 | 0 | 0 | 0 | 0 | 0 | 11 |
| 12 | 4.0 | -0.7 | -6.0 | 3.0 | 2.2 | 0.0 | N | 2.2 | 12 | 7 | 1024.0 | 92.0 | 1.7 | 0 | 0 | 0 | 0 | 0 | 0 | 12 |
| 13 | 3.3 | -1.4 | -4.3 | 3.0 | 0.6 | 1.1 | S | 2.6 | 14 | 8 | 1027.0 | 93.7 | 1.3 | 1 | 0 | 0 | 0 | 0 | 0 | 13 |
| 14 | 3.4 | 2.1 | 2.0 | 3.4 | 0.1 | TR | N | 1.9 | 14 | 8 | 1032.5 | 91.2 | 2.0 | 1 | 0 | 0 | 0 | 0 | 0 | 14 |
| 15 | 5.6 | -1.6 | -6.6 | 3.5 | 0.0 | 2.8 | W | 5.2 | 22 | 8 | 1033.5 | 93.9 | 1.8 | 1 | 1 | 0 | 0 | 0 | 0 | 15 |
| 16 | 6.5 | 2.4 | 1.8 | 3.6 | 0.0 | 4.2 | SW | 8.9 | 28 | 8 | 1008.2 | 89.8 | 2.6 | 0 | 0 | 1 | 0 | 0 | 0 | 16 |
| 17 | -1.2 | -4.9 | -9.5 | 3.7 | 4.6 | TR | W | 5.3 | 16 | 7 | 997.1 | 83.2 | -3.5 | 0 | 0 | 1 | 1 | 0 | 0 | 17 |
| 18 | 0.0 | -5.9 | -9.0 | 3.1 | 0.1 | 8.4 | SE | 4.4 | 18 | 8 | 992.1 | 88.5 | -3.2 | 0 | 0 | 1 | 1 | 0 | 0 | 18 |
| 19 | -2.7 | -8.1 | -14.5 | 2.9 | 0.0 | 0.0 | N | 1.2 | 10 | 8 | 995.0 | 91.0 | -5.5 | 0 | 0 | 0 | 1 | 0 | 0 | 19 |
| 20 | -2.5 | -11.0 | -13.8 | 2.8 | 0.2 | TR | N | 0.6 | 6 | 8 | 1001.5 | 90.1 | -6.4 | 1 | 1 | 0 | 1 | 0 | 0 | 20 |
| 21 | 0.2 | -6.3 | -9.4 | 2.8 | 0.0 | 1.1 | CALM | 1.3 | 9 | 8 | 1002.9 | 91.7 | -2.4 | 0 | 0 | 1 | 1 | 0 | 0 | 21 |
| 22 | 0.8 | -1.0 | -1.5 | 2.7 | 0.0 | TR | N | 2.5 | 21 | 8 | 1005.7 | 91.7 | -0.6 | 0 | 0 | 1 | 1 | 0 | 0 | 22 |
| 23 | 1.4 | -5.0 | -9.0 | 2.7 | 0.0 | 0.1 | N | 6.6 | 23 | 8 | 1010.6 | 86.1 | -0.7 | 0 | 0 | 1 | 1 | 0 | 0 | 23 |
| 24 | 0.5 | -2.4 | -5.5 | 2.8 | 0.0 | 0.0 | NW | 4.4 | 19 | 8 | 1018.4 | 87.3 | -0.7 | 0 | 0 | 0 | 1 | 0 | 0 | 24 |
| 25 | -0.5 | -2.5 | -2.0 | 2.8 | 4.6 | 0.0 | NW | 5.3 | 17 | 8 | 1026.7 | 84.4 | -1.9 | 0 | 0 | 0 | 1 | 0 | 0 | 25 |
| 26 | 2.5 | -3.8 | -7.6 | 2.6 | 4.0 | 0.0 | W | 5.2 | 14 | 1 | 1026.2 | 78.5 | -1.4 | 0 | 0 | 0 | 1 | 0 | 0 | 26 |
| 27 | 3.2 | -0.5 | -2.5 | 2.5 | 0.1 | 3.5 | S | 7.0 | 26 | 8 | 1015.4 | 82.1 | 2.1 | 0 | 0 | 0 | 1 | 0 | 0 | 27 |
| 28 | 6.7 | 1.3 | 0.4 | 2.6 | 0.0 | 0.2 | SE | 7.1 | 21 | 8 | 1013.0 | 92.5 | 2.9 | 0 | 0 | 0 | 1 | 0 | 0 | 28 |
| 29 | 7.5 | 4.5 | 3.0 | 3.0 | 0.4 | 0.0 | S | 3.4 | 13 | 6 | 1019.0 | 95.9 | 6.2 | 0 | 0 | 0 | 0 | 0 | 0 | 29 |
| 30 | 6.0 | 4.6 | 3.9 | 3.9 | 0.0 | 0.2 | E | 0.6 | 5 | 8 | 1024.1 | 96.0 | 5.1 | 1 | 0 | 0 | 0 | 0 | 0 | 30 |
| 31 | 5.0 | 4.0 | 3.5 | 4.4 | 0.0 | 0.0 | NW | 1.3 | 11 | 8 | 1025.6 | 96.0 | 4.5 | 0 | 0 | 0 | 0 | 0 | 0 | 31 |
| Total/Mean | 2.4 | -2.1 | -4.6 | 3.1 | 37.5 | 24.5 | X | 4.5 | X | 6.9 | 1014.0 | 89.1 | 0.1 | 7 | 2 | 10 | 16 | 0 | 0 | Total/Mean |
| *Diff./% | -4.7 | -5.1 | 79% | 46% | *Diff./% | |||||||||||||||
| Date | Max. Temp. (°C) 09/09h | Min. Temp. (°C) 09/09h | Grass Min. Temp. (°C) 21/09h | Earth (30cms) Temp. (°C) 09h | Sun (Hours) 00/00h | R'fall (MM) 09/09h | Wind Dir'n 09h | Mean Wind Speed (MPH) 00/00h | Max. Gust Speed (MPH) 00/00h | Cloud Cover (Oktas) 09h | Mean MSL Air Pressure (mB) 00/00h | Mean Rel. Humd. (%) 00/00h | Mean Temp. (°C) 00/00h | Fog (vis. <1000m @ 09h) | Fog (vis. <200m @ 09h) | Snow or Rain and Snow 00/00h | Snow Lying @ 09h (>50% cover) | Hail 00/00h | Thunder 00/00h | Date |
Differences from average:
Differences from average shown in red. Reference periods used are as follows: Temperature 30 Years 1976/2005; rainfall 30 Years 1971/2000; sunshine 30 Years 1971/2000.
(*The differences from average quoted during the course of the month relate to the cumulative daily averages up to the date of the last observation, not the averages for the month as a whole)
Additional Data:
Rainfall Duration N/A
Air Frost Duration 386.5 hours
Graphs and Charts:
Click on the following links to view this month's graphs and charts.....
1. Daily Maximum, Minimum & Grass Minimum Temperatures
2. Daily Maximum & Minimum Temperatures (with 30 Year Comparative Means)
3. Daily Earth (30 cms Depth) Temperature @ 0900 GMT 4. Daily Rainfall 5. Daily Sunshine
6. Daily Maximum Gust & Mean Wind Speed 7. Daily Wind Direction @ 0900 GMT
8. Daily Mean MSL Air Pressure 9. Daily Mean Relative Humidity 10. Thermograph
11. Barograph 12. Hygrograph 13. Anemograph 14. Wind Direction
December 2010 Weather Review:
......and click on the link below for a text report of the December 2010 weather in Royston
December (since 1972) at Royston (Iceni) Weather Station:
Mean day maximum temperature (30 years 1976/2005) 7.1°C
Mean night minimum temperature (30 years 1976/2005) 3.0°C
Highest temperature 15.1°C (2nd December 1985); lowest temperature -9.8°C (29th December 1995)
Lowest grass minimum temperature -14.6°C (13th December 1981)
Warmest December 1974 (Mean temperature 7.8°C); coldest December 1981 (Mean temperature 0.4°C)
Average December rainfall (30 years 1971/2000) 52.8 mm
Wettest December 1989 (Rainfall 122.4 mm); driest December 1991 (Rainfall 10.3 mm)
Wettest Day 27th December 1979 (Rainfall 31.5 mm);
Highest number of "rain days" (0.2 mm or more) 22 (1978); lowest number of "rain days" 7 (2004)
Highest number of days with thunder 3 (1989)
Highest number of air frosts 20 (1981)
Highest number of ground frosts 25 (1981)
Highest number of days with snow falling 10 (1981)
Highest number of days with snow lying (ground with more than 50% snow cover @ 0900 GMT) 23 (1981)
|
|
|
|
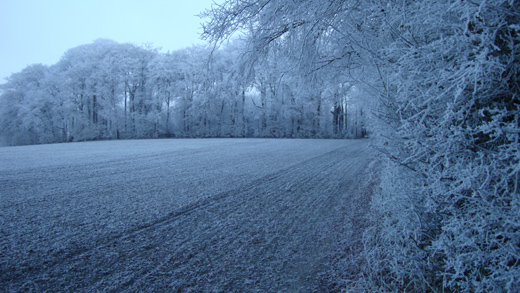
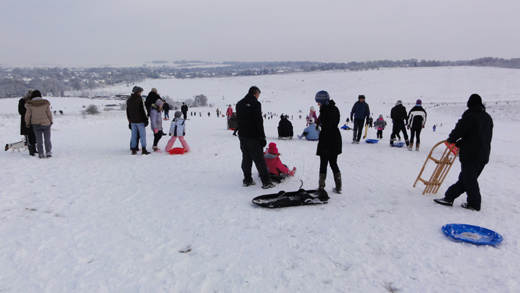
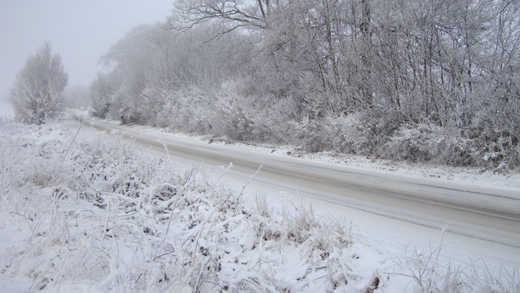
| On 7th December 2010 a thick but variable hoar frost covered trees and other vegetation in and around Royston. The trees in the background of this picture (taken at 0844 GMT) are on Hyde Hill to the east of the town, whilst the trees on the right are on the northern boundary of the Newmarket Road Plantation. The temperature at the time was -6.4°C after an overnight minimum of -7.0°C, and the temperature then remained below 0°C all day, despite a creditable 3.7 hours bright sunshine. The unseasonably cold spell which had set in 24th November was still continuing on this date, with air frost on every day except one, and a snow cover on 5 days. | On the afternoon of 18th December a band of snow to the south of Royston edged just far enough north to envelop Royston with a heavy snowfall, a level depth of 14 cm being measured at 0900 GMT the next day. An overnight minimum temperature of -8.1°C and a grass minimum temperature of -14.5°C occurred over this snow cover. In this picture taken at 1220 GMT on 19th December Therfield Heath, Royston with its many snow runs is well populated with people and toboggans in a light ENE wind of mean speed 2 knots gusting to 4 knots, and a temperature of -3.3°C. This view is from the Tumulus at the eastern end of the Heath looking eastwards towards the town. | This is the B1039 Royston to Saffron Walden Road some 3 km SE of Royston on 20th December 2010 at 0916 GMT, some 40 hours after the snowfall on 19th December as mentioned in the adjacent caption. The temperature at this time was an exceptionally low -10.7°C; in fact, the minimum temperature of -11.0°C which had occurred half an hour earlier at 0845 GMT was the lowest temperature recorded in December in Royston since at least 1972, and the lowest temperature recorded in any month since 12th January 1987 (-12.5°C). The temperature later rose to a maximum of only -2.5°C, only slightly higher than the maximum temperature of the previous day of -2.7°C. |
Return to Welcome to Royston (Iceni) Weather Station page
(This page last updated 8th January 2011 2114 GMT)