Royston (Iceni) Weather Station
Daily Weather Observations - February 2012
(All Times GMT)
| Date | Max. Temp. (°C) 09/09h | Min. Temp. (°C) 09/09h | Grass Min. Temp. (°C) 21/09h | Earth (30cms) Temp. (°C) 09h | Sun (Hours) 00/00h | R'fall (MM) 09/09h | Wind Dir'n 09h | Mean Wind Speed (MPH) 00/00h | Max. Gust Speed (MPH) 00/00h | Cloud Cover (Oktas) 09h | Mean MSL Air Pressure (mB) 00/00h | Mean Rel. Humd. (%) 00/00h | Mean Temp. (°C) 00/00h | Fog (vis. <1000m @ 09h) | Fog (vis. <200m @ 09h) | Snow or Rain and Snow 00/00h | Snow Lying @ 09h (>50% cover) | Hail 00/00h | Thunder 00/00h | Date |
| 1 | 2.5 | -5.1 | -9.1 | 4.2 | 7.9 | 0.0 | NE | 4.7 | 21 | 0 | 1033.7 | 79.0 | -1.9 | 0 | 0 | 0 | 0 | 0 | 0 | 1 |
| 2 | 1.4 | -6.1 | -9.7 | 3.5 | 7.3 | 0.0 | NE | 4.2 | 21 | 1 | 1036.5 | 73.3 | -2.8 | 0 | 0 | 0 | 0 | 0 | 0 | 2 |
| 3 | 2.0 | -7.0 | -11.0 | 2.9 | 6.9 | 0.0 | NE | 2.3 | 18 | 2 | 1039.0 | 83.2 | -3.2 | 0 | 0 | 0 | 0 | 0 | 0 | 3 |
| 4 | -0.3 | -6.4 | -10.7 | 2.5 | 1.3 | 13.0 | NW | 6.5 | 28 | 0 | 1034.6 | 87.0 | -2.9 | 0 | 0 | 1 | 0 | 0 | 0 | 4 |
| 5 | 1.4 | -2.6 | -2.0 | 2.4 | 0.0 | TR | S | 3.0 | 25 | 8 | 1027.0 | 96.1 | 0.1 | 1 | 0 | 1 | 1 | 0 | 0 | 5 |
| 6 | 3.4 | 0.5 | -0.5 | 2.3 | 0.6 | 0.8 | S | 2.1 | 13 | 8 | 1032.7 | 94.6 | 1.5 | 0 | 0 | 0 | 1 | 0 | 0 | 6 |
| 7 | 3.0 | 0.0 | -1.5 | 2.2 | 8.0 | 0.0 | S | 1.9 | 12 | 2 | 1040.2 | 84.4 | -1.3 | 0 | 0 | 1 | 1 | 0 | 0 | 7 |
| 8 | 0.0 | -7.6 | -8.4 | 2.1 | 0.0 | 0.0 | NE | 3.8 | 16 | 8 | 1041.4 | 84.1 | -1.4 | 0 | 0 | 0 | 1 | 0 | 0 | 8 |
| 9 | 0.1 | -2.0 | -2.0 | 2.1 | 0.0 | 2.2 | NW | 1.7 | 9 | 8 | 1038.8 | 86.8 | -0.8 | 0 | 0 | 1 | 1 | 0 | 0 | 9 |
| 10 | 1.1 | -2.5 | -5.5 | 2.1 | 7.3 | 0.0 | SE | 1.6 | 15 | 7 | 1038.0 | 85.6 | -2.2 | 0 | 0 | 0 | 1 | 0 | 0 | 10 |
| 11 | 0.5 | -11.5 | -15.3 | 2.0 | 8.8 | 0.0 | SE | 0.8 | 11 | 0 | 1036.6 | 87.4 | -6.7 | 0 | 0 | 0 | 1 | 0 | 0 | 11 |
| 12 | 3.8 | -7.6 | -12.7 | 2.0 | 0.1 | 0.2 | W | 3.8 | 12 | 8 | 1033.8 | 92.0 | 0.3 | 0 | 0 | 0 | 1 | 0 | 0 | 12 |
| 13 | 5.2 | 0.5 | -2.9 | 2.0 | 0.0 | 0.6 | W | 7.2 | 23 | 8 | 1026.2 | 93.5 | 3.2 | 0 | 0 | 0 | 1 | 0 | 0 | 13 |
| 14 | 7.5 | 2.3 | 0.5 | 2.1 | 0.6 | 0.2 | NW | 7.9 | 21 | 8 | 1023.7 | 84.6 | 4.8 | 0 | 0 | 0 | 0 | 0 | 0 | 14 |
| 15 | 9.9 | 5.1 | 3.5 | 2.2 | 1.7 | 0.0 | NW | 10.1 | 27 | 5 | 1024.4 | 82.5 | 7.4 | 0 | 0 | 0 | 0 | 0 | 0 | 15 |
| 16 | 10.8 | 5.0 | 3.1 | 3.3 | 4.8 | 0.0 | W | 7.4 | 20 | 2 | 1026.1 | 81.6 | 7.2 | 0 | 0 | 0 | 0 | 0 | 0 | 16 |
| 17 | 11.7 | 6.6 | 4.3 | 4.0 | 0.2 | TR | SW | 8.1 | 21 | 8 | 1021.5 | 87.4 | 9.2 | 0 | 0 | 0 | 0 | 0 | 0 | 17 |
| 18 | 9.9 | 7.4 | 6.6 | 5.0 | 0.6 | 2.2 | SW | 12.3 | 40 | 7 | 1010.4 | 84.4 | 6.6 | 0 | 0 | 0 | 0 | 0 | 0 | 18 |
| 19 | 7.1 | -0.4 | -2.3 | 4.6 | 9.1 | 0.0 | NW | 6.5 | 22 | 0 | 1023.4 | 72.5 | 1.9 | 0 | 0 | 0 | 0 | 0 | 0 | 19 |
| 20 | 8.0 | -0.5 | -5.6 | 3.7 | 4.0 | 0.0 | S | 9.1 | 24 | 5 | 1030.4 | 70.2 | 3.9 | 0 | 0 | 0 | 0 | 0 | 0 | 20 |
| 21 | 12.0 | 3.6 | 1.5 | 3.9 | 6.3 | 0.0 | SW | 9.8 | 25 | 1 | 1027.1 | 81.9 | 7.7 | 0 | 0 | 0 | 0 | 0 | 0 | 21 |
| 22 | 12.8 | 6.6 | 4.7 | 4.7 | 0.0 | 1.5 | SW | 14.1 | 39 | 8 | 1021.1 | 87.1 | 8.6 | 0 | 0 | 0 | 0 | 0 | 0 | 22 |
| 23 | 16.9 | 10.3 | 7.6 | 5.5 | 9.3 | 0.0 | SW | 9.7 | 23 | 7 | 1021.5 | 87.8 | 12.2 | 0 | 0 | 0 | 0 | 0 | 0 | 23 |
| 24 | 14.8 | 8.0 | 5.6 | 6.3 | 5.3 | 0.0 | SW | 8.3 | 26 | 3 | 1025.9 | 87.0 | 10.1 | 0 | 0 | 0 | 0 | 0 | 0 | 24 |
| 25 | 11.1 | 2.9 | -1.1 | 6.5 | 7.2 | 0.0 | NW | 5.0 | 20 | 6 | 1026.9 | 79.0 | 6.2 | 0 | 0 | 0 | 0 | 0 | 0 | 25 |
| 26 | 13.1 | 3.2 | -1.0 | 5.8 | 8.4 | 1.4 | W | 4.4 | 15 | 0 | 1027.5 | 81.0 | 6.9 | 0 | 0 | 0 | 0 | 0 | 0 | 26 |
| 27 | 11.2 | 5.1 | 2.9 | 5.9 | 0.0 | 0.1 | SW | 7.6 | 18 | 8 | 1023.4 | 88.5 | 8.6 | 0 | 0 | 0 | 0 | 0 | 0 | 27 |
| 28 | 12.0 | 9.3 | 8.6 | 6.7 | 0.4 | 0.1 | W | 5.5 | 17 | 7 | 1023.1 | 92.1 | 10.2 | 0 | 0 | 0 | 0 | 0 | 0 | 28 |
| 29 | 11.9 | 8.4 | 7.5 | 7.4 | 0.0 | 0.0 | SW | 4.8 | 14 | 8 | 1023.8 | 89.4 | 10.0 | 0 | 0 | 0 | 0 | 0 | 0 | 29 |
| Total/Mean | 7.1 | 0.9 | -1.5 | 3.8 | 106.1 | 22.3 | X | 6.0 | X | 4.9 | 1028.9 | 85.0 | 3.6 | 1 | 0 | 4 | 9 | 0 | 0 | Total/Mean |
| *Diff./% | -0.3 | -1.1 | 131% | 58% | *Diff./% | |||||||||||||||
| Date | Max. Temp. (°C) 09/09h | Min. Temp. (°C) 09/09h | Grass Min. Temp. (°C) 21/09h | Earth (30cms) Temp. (°C) 09h | Sun (Hours) 00/00h | R'fall (MM) 09/09h | Wind Dir'n 09h | Mean Wind Speed (MPH) 00/00h | Max. Gust Speed (MPH) 00/00h | Cloud Cover (Oktas) 09h | Mean MSL Air Pressure (mB) 00/00h | Mean Rel. Humd. (%) 00/00h | Mean Temp. (°C) 00/00h | Fog (vis. <1000m @ 09h) | Fog (vis. <200m @ 09h) | Snow or Rain and Snow 00/00h | Snow Lying @ 09h (>50% cover) | Hail 00/00h | Thunder 00/00h | Date |
Differences from average:
Differences from average shown in red. Reference periods used are as follows: Temperature 30 Years 1981/2010; rainfall 30 Years 1981/2010; sunshine 30 Years 1971/2000.
(*The differences from average quoted during the course of the month relate to the cumulative daily averages up to the date of the last observation, not the averages for the month as a whole)
Additional Data:
Rainfall Duration N/A
Air Frost Duration 200.3 hours
Graphs and Charts:
Click on the following links to view this month's graphs and charts.....
1. Daily Maximum, Minimum & Grass Minimum Temperatures
2. Daily Maximum & Minimum Temperatures (with 30 Year Comparative Means)
3. Daily Earth (30 cms Depth) Temperature @ 0900 GMT 4. Daily Rainfall 5. Daily Sunshine
6. Daily Maximum Gust & Mean Wind Speed 7. Daily Wind Direction @ 0900 GMT
8. Daily Mean MSL Air Pressure 9. Daily Mean Relative Humidity 10. Thermograph
11. Barograph 12. Hygrograph 13. Anemograph 14. Wind Direction
15. Rainfall Intensity & Duration
February 2012 Weather Review:
......and click on the link below for a text report of the February 2012 weather in Royston
February (since 1973) at Royston (Iceni) Weather Station:
Mean day maximum temperature (30 years 1981/2010) 7.4°C
Mean night minimum temperature (30 years 1981/2010) 2.0°C
Highest temperature 18.5°C (13th February 1998); lowest temperature -10.5°C (12th & 13th February 1985)
Lowest grass minimum temperature -14.5°C (10th February 1986)
Warmest February 1990 (Mean temperature 8.1°C); coldest February 1986 (Mean temperature -1.6°C)
Average February rainfall (30 years 1981/2010) 38.5 mm
Wettest February 2001 (Rainfall 90.7 mm); driest February 1998 (Rainfall 4.8 mm)
Wettest Day 7th February 2001 (Rainfall 21.8 mm);
Highest number of "rain days" (0.2 mm or more) 24 (2010); lowest number of "rain days" 5 (1998)
Highest number of days with thunder 2 (1995)
Highest number of air frosts 24 (1986)
Highest number of ground frosts 25 (1986)
Highest number of days with snow falling 15 (1986)
Highest number of days with snow lying (ground with more than 50% snow cover @ 0900 GMT) 23 (1986)
|
|
|
|
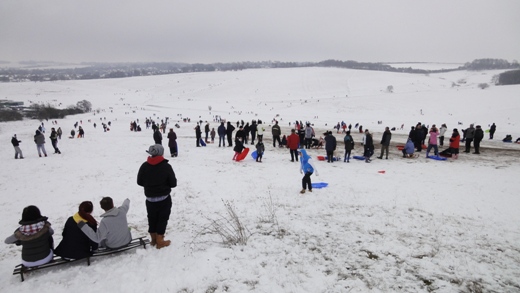
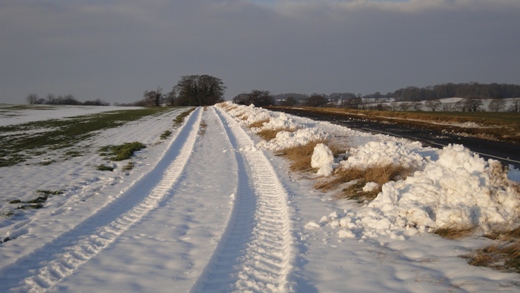
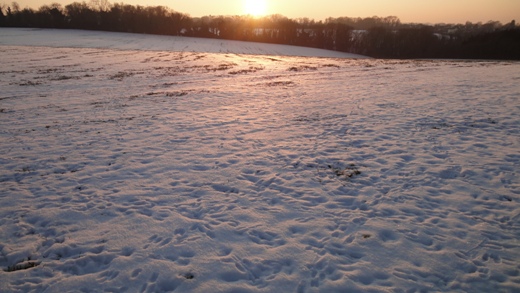
| A cold spell which commenced on 29th January 2012 intensified at the beginning of February and by the time the first snowfall occurred in the evening of 4th the ground was already in a frozen state. This snowfall gave a level depth of snow of 14 cm at 0900 GMT on 5th with moderate drifting in places. On the morning of 5th February large numbers of people had ventured on to Therfield Heath, Royston to take advantage of the snowy conditions for tobogganing on its many slopes. This picture was taken at 1149 GMT from the single Tumulus at the eastern end of the Heath looking eastwards towards the town and down into the dry valley below. The temperature was 1.4°C (the maximum temperature of the day) at the time and it was feeling not too cold in the light WSW breeze of mean speed 2 knots gusting to 4 knots. With the snowfall had come a higher night minimum temperature on 4th/5th of -2.6°C, after night minima of -6.4°C,-7.0°C, -6.1°C and -5.1°C on the four previous nights respectively. | A modest thaw had reduced the snowfall of the 4th/5th February 2012 (see previous photograph) to a level depth of 7 cm by 0900 GMT on 7th. In the meantime the snow on the B1039 Royston to Barley road had been cleared off the carriageway and piled by the side of the road as pictured above (at 0848 GMT on 7th). This picture was taken about half way between Royston and Barley looking north-westwards towards Royston, and close to where the bridleway leaves the road on its descent to Wardington Bottom before ascending the ridge over which it passes to gain access to the village of Barley. At 0.2°C at this time the temperature is just above the overnight minimum of 0.0°C, whilst a light SSW air of mean speed 2 knots gusting to 4 knots is traversing the scene. The early morning sunshine illuminating the snow in this picture lasted most of the day and had accumulated a sunshine total of 8.0 hours by the end of the day, making it the sunniest day of the year to date (but exceeded on 11th, see next caption). | The severe snowy spell during the first half of February 2012 gave a 9 day continuous snow cover fro 5th to 13th inclusive (as observed at 0900 GMT daily). Further snowfall on 9th increased the level depth of snow from 5 cm on at 0900 GMT on 9th to 10 cm at 0900 GMT on 10th. The overnight minimum temperature of -11.5°C recorded on 10th/11th was the lowest temperature experienced in February in Royston since at least 1972 when records began at this station. A grass minimum temperature of -15.3°C was also recorded on this date. In the picture above (taken at 1640 GMT on 11th February 2012) the setting sun is illuminating the snow in the first arable field out of Royston on west side the Barkway Road, looking towards the tree belt through which passes the Hertfordshire Way as it climbs from Grange Bottom up to the crest of the ridge close to Flint Hall Farm before descending to Lovers Walk on its way to Reed. The temperature at the this time is -3.1°C in calm conditions, whilst a total of 8.8 hours sunshine was recorded for the day. |
Return to Welcome to Royston (Iceni) Weather Station page
(This page last updated 12th March 2012 2051 GMT)