Royston (Iceni) Weather Station
Daily Weather Observations - May 2012
(All Times GMT)
| Date | Max. Temp. (°C) 09/09h | Min. Temp. (°C) 09/09h | Grass Min. Temp. (°C) 21/09h | Earth (30cms) Temp. (°C) 09h | Sun (Hours) 00/00h | R'fall (MM) 09/09h | Wind Dir'n 09h | Mean Wind Speed (MPH) 00/00h | Max. Gust Speed (MPH) 00/00h | Cloud Cover (Oktas) 09h | Mean MSL Air Pressure (mB) 00/00h | Mean Rel. Humd. (%) 00/00h | Mean Temp. (°C) 00/00h | Fog (vis. <1000m @ 09h) | Fog (vis. <200m @ 09h) | Snow or Rain and Snow 00/00h | Snow Lying @ 09h (>50% cover) | Hail 00/00h | Thunder 00/00h | Date |
| 1 | 15.9 | 9.5 | 9.0 | 11.1 | 1.2 | 3.6 | NE | 3.2 | 19 | 8 | 1016.8 | 94.9 | 11.5 | 0 | 0 | 0 | 0 | 0 | 0 | 1 |
| 2 | 14.0 | 7.7 | 8.7 | 11.5 | 0.1 | 28.4 | NW | 5.3 | 20 | 8 | 1019.0 | 91.6 | 9.7 | 0 | 0 | 0 | 0 | 0 | 0 | 2 |
| 3 | 8.0 | 6.5 | 6.9 | 11.3 | 0.1 | 1.9 | NE | 5.2 | 22 | 8 | 1011.5 | 96.8 | 7.4 | 0 | 0 | 0 | 0 | 0 | 0 | 3 |
| 4 | 9.4 | 5.7 | 6.5 | 10.5 | 0.1 | 0.1 | N | 3.9 | 20 | 8 | 1006.8 | 91.6 | 7.4 | 0 | 0 | 0 | 0 | 0 | 0 | 4 |
| 5 | 10.0 | 3.6 | 4.2 | 10.3 | 2.6 | 0.0 | NE | 5.2 | 19 | 7 | 1010.2 | 79.1 | 6.7 | 0 | 0 | 0 | 0 | 0 | 0 | 5 |
| 6 | 9.5 | 3.7 | 3.4 | 10.2 | 0.5 | 0.1 | NE | 2.4 | 13 | 8 | 1014.2 | 81.0 | 6.0 | 0 | 0 | 0 | 0 | 0 | 0 | 6 |
| 7 | 12.7 | 2.0 | -1.6 | 9.8 | 3.2 | 1.6 | SE | 5.0 | 21 | 7 | 1013.2 | 85.4 | 8.7 | 0 | 0 | 0 | 0 | 0 | 0 | 7 |
| 8 | 17.4 | 9.9 | 7.9 | 10.5 | 1.2 | 4.5 | S | 6.4 | 22 | 8 | 1006.1 | 81.1 | 13.3 | 0 | 0 | 0 | 0 | 0 | 0 | 8 |
| 9 | 17.1 | 9.0 | 8.9 | 11.9 | 0.0 | 4.0 | NW | 4.8 | 23 | 8 | 1007.6 | 93.6 | 12.2 | 0 | 0 | 0 | 0 | 0 | 0 | 9 |
| 10 | 19.8 | 13.6 | 13.0 | 12.4 | 3.6 | 3.1 | SW | 13.6 | 42 | 3 | 1007.4 | 89.1 | 15.7 | 0 | 0 | 0 | 0 | 1 | 0 | 10 |
| 11 | 15.8 | 9.7 | 7.5 | 13.1 | 9.3 | 0.0 | W | 10.2 | 29 | 7 | 1021.3 | 72.6 | 11.7 | 0 | 0 | 0 | 0 | 0 | 0 | 11 |
| 12 | 16.2 | 3.0 | 1.4 | 12.4 | 10.9 | 0.0 | N | 4.8 | 18 | 1 | 1036.3 | 68.6 | 9.3 | 0 | 0 | 0 | 0 | 0 | 0 | 12 |
| 13 | 17.1 | 4.9 | 1.0 | 12.4 | 10.6 | 0.7 | SW | 6.9 | 23 | 1 | 1028.6 | 62.7 | 11.4 | 0 | 0 | 0 | 0 | 0 | 0 | 13 |
| 14 | 12.9 | 7.0 | 6.5 | 12.5 | 0.6 | 2.7 | SW | 8.5 | 27 | 8 | 1014.4 | 84.2 | 8.8 | 0 | 0 | 0 | 0 | 0 | 0 | 14 |
| 15 | 12.1 | 4.1 | 2.4 | 11.6 | 2.1 | 3.3 | NW | 6.8 | 25 | 6 | 1015.0 | 87.4 | 7.0 | 0 | 0 | 0 | 0 | 0 | 0 | 15 |
| 16 | 15.2 | 3.0 | 0.9 | 11.1 | 7.7 | 0.0 | NW | 5.7 | 17 | 5 | 1024.3 | 71.2 | 8.9 | 0 | 0 | 0 | 0 | 0 | 0 | 16 |
| 17 | 14.1 | 7.2 | 6.6 | 12.0 | 0.9 | 0.0 | S | 4.2 | 19 | 8 | 1016.3 | 71.3 | 10.6 | 0 | 0 | 0 | 0 | 0 | 0 | 17 |
| 18 | 18.1 | 7.6 | 6.5 | 12.5 | 1.8 | 3.1 | NE | 3.3 | 18 | 8 | 1004.5 | 81.2 | 12.3 | 0 | 0 | 0 | 0 | 0 | 0 | 18 |
| 19 | 14.7 | 11.3 | 10.9 | 13.4 | 0.2 | TR | NE | 5.0 | 16 | 8 | 1009.6 | 90.5 | 11.5 | 0 | 0 | 0 | 0 | 0 | 0 | 19 |
| 20 | 10.6 | 7.7 | 8.0 | 13.3 | 0.1 | 0.1 | NE | 5.6 | 21 | 8 | 1010.9 | 92.1 | 9.3 | 0 | 0 | 0 | 0 | 0 | 0 | 20 |
| 21 | 15.3 | 8.3 | 8.5 | 12.5 | 0.0 | 0.0 | N | 4.4 | 19 | 8 | 1009.5 | 89.3 | 11.2 | 0 | 0 | 0 | 0 | 0 | 0 | 21 |
| 22 | 24.1 | 9.6 | 8.0 | 12.9 | 11.0 | 0.0 | NW | 4.8 | 18 | 3 | 1015.0 | 83.4 | 15.7 | 0 | 0 | 0 | 0 | 0 | 0 | 22 |
| 23 | 20.9 | 10.4 | 7.9 | 14.5 | 3.2 | 0.0 | N | 2.5 | 13 | 8 | 1022.8 | 90.9 | 15.4 | 1 | 0 | 0 | 0 | 0 | 0 | 23 |
| 24 | 24.8 | 11.0 | 9.3 | 14.9 | 7.5 | 0.0 | NW | 2.2 | 12 | 8 | 1026.0 | 88.4 | 17.4 | 1 | 0 | 0 | 0 | 0 | 0 | 24 |
| 25 | 24.5 | 10.8 | 9.5 | 15.9 | 15.2 | 0.0 | NE | 4.5 | 21 | 0 | 1024.1 | 73.0 | 17.7 | 0 | 0 | 0 | 0 | 0 | 0 | 25 |
| 26 | 25.2 | 12.0 | 9.4 | 16.5 | 15.7 | 0.0 | NE | 3.5 | 20 | 0 | 1020.8 | 69.8 | 18.1 | 0 | 0 | 0 | 0 | 0 | 0 | 26 |
| 27 | 26.5 | 9.6 | 6.6 | 16.9 | 15.7 | 0.0 | NE | 2.1 | 17 | 0 | 1018.8 | 68.8 | 18.1 | 0 | 0 | 0 | 0 | 0 | 0 | 27 |
| 28 | 26.9 | 10.9 | 7.8 | 17.4 | 14.6 | TR | E | 2.4 | 17 | 0 | 1017.2 | 72.6 | 18.8 | 0 | 0 | 0 | 0 | 0 | 1 | 28 |
| 29 | 20.6 | 12.8 | 10.5 | 18.0 | 4.3 | 0.0 | N | 3.8 | 18 | 8 | 1017.2 | 85.5 | 14.9 | 0 | 0 | 0 | 0 | 0 | 0 | 29 |
| 30 | 25.8 | 12.2 | 11.0 | 16.9 | 11.9 | 7.6 | SW | 5.7 | 26 | 1 | 1016.9 | 79.4 | 17.6 | 0 | 0 | 0 | 0 | 0 | 1 | 30 |
| 31 | 19.4 | 12.0 | 10.6 | 17.6 | 0.2 | 0.2 | W | 7.8 | 23 | 7 | 1017.4 | 85.5 | 15.4 | 0 | 0 | 0 | 0 | 0 | 0 | 31 |
| Total/Mean | 17.2 | 8.3 | 7.0 | 13.2 | 156.0 | 65.0 | X | 5.2 | X | 5.7 | 1016.1 | 82.3 | 12.2 | 2 | 0 | 0 | 0 | 1 | 2 | Total/Mean |
| *Diff./% | -0.1 | +0.6 | 84% | 127% | *Diff./% | |||||||||||||||
| Date | Max. Temp. (°C) 09/09h | Min. Temp. (°C) 09/09h | Grass Min. Temp. (°C) 21/09h | Earth (30cms) Temp. (°C) 09h | Sun (Hours) 00/00h | R'fall (MM) 09/09h | Wind Dir'n 09h | Mean Wind Speed (MPH) 00/00h | Max. Gust Speed (MPH) 00/00h | Cloud Cover (Oktas) 09h | Mean MSL Air Pressure (mB) 00/00h | Mean Rel. Humd. (%) 00/00h | Mean Temp. (°C) 00/00h | Fog (vis. <1000m @ 09h) | Fog (vis. <200m @ 09h) | Snow or Rain and Snow 00/00h | Snow Lying @ 09h (>50% cover) | Hail 00/00h | Thunder 00/00h | Date |
Differences from average:
Differences from average shown in red. Reference periods used are as follows: Temperature 30 Years 1976/2005; rainfall 30 Years 1971/2000; sunshine 30 Years 1971/2000.
(*The differences from average quoted during the course of the month relate to the cumulative daily averages up to the date of the last observation, not the averages for the month as a whole)
Additional Data:
Rainfall Duration N/A
Air Frost Duration NIL hours
Graphs and Charts:
Click on the following links to view this month's graphs and charts.....
1. Daily Maximum, Minimum & Grass Minimum Temperatures
2. Daily Maximum & Minimum Temperatures (with 30 Year Comparative Means)
3. Daily Earth (30 cms Depth) Temperature @ 0900 GMT 4. Daily Rainfall 5. Daily Sunshine
6. Daily Maximum Gust & Mean Wind Speed 7. Daily Wind Direction @ 0900 GMT
8. Daily Mean MSL Air Pressure 9. Daily Mean Relative Humidity 10. Thermograph
11. Barograph 12. Hygrograph 13. Anemograph 14. Wind Direction
15. Rainfall Intensity & Duration
May 2012 Weather Review:
......and click on the link below for a text report of the May 2012 weather in Royston
May (since 1972) at Royston (Iceni) Weather Station:
Mean daily maximum temperature (30 years 1981/2010) 17.3°C
Mean daily minimum temperature (30 years 1981/2010) 7.7°C
Highest temperature 30.3°C (27th May 2005); lowest temperature -1.0°C (16th May1996)
Lowest grass minimum temperature -5.2°C (16th May 1996)
Warmest May 1992 (Mean temperature 14.5°C); coldest May 1984, 1996 (Mean temperature 9.7°C)
Average May rainfall (30 years 1981/2010) 51.0 mm
Wettest May 2007 (Rainfall 147.5 mm); driest May 1990 (Rainfall 3.7 mm)
Wettest Day 27th May 2007 (Rainfall 65.7 mm)
Highest number of "rain days" (0.2 mm or more) 22 (1983); lowest number of "rain days" 3 (1990)
Highest number of days with thunder 8 (1983)
Highest number of air frosts 4 (1996)
Highest number of ground frosts 14 (1996)
Highest number of days with snow falling 2 (1997)
Highest number of days with snow lying (ground with more than 50% snow cover @ 0900 GMT) 0
|
|
|
|
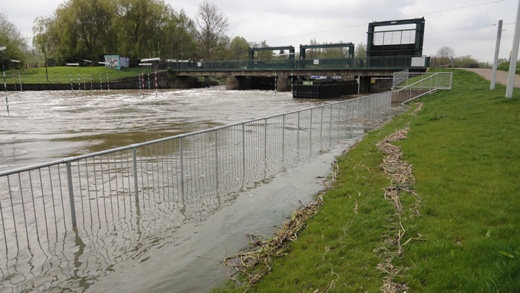
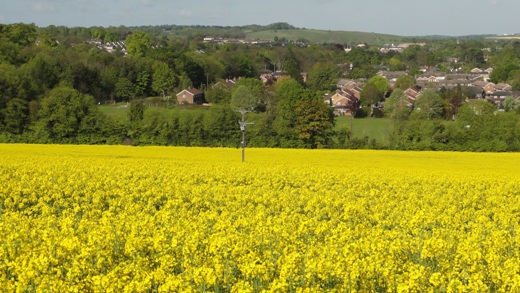
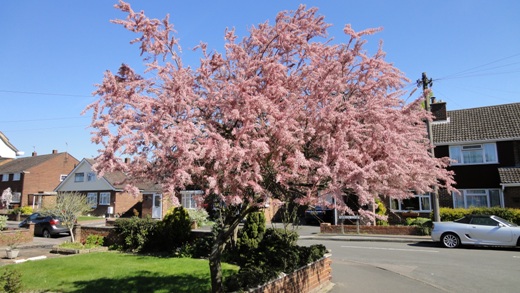
| The exceptionally heavy rainfall in the second half of April took its toll with flooding across the region although there was little sign of excess water in Royston due to the town being built on very well drained chalk and exhibiting no surface drainage. However, the Great Ouse catchment in which Royston is situated did suffer surface flooding in places including the flood plain at Godmanchester (32 km NNW of Royston) which was partially covered with water in early May. The adjoining Nene catchment also experienced flooding and in this picture taken at Orton Staunch 2 km upstream from the cathedral city of Peterborough (65 km NNW of Royston) on 2nd May 2012 at 1112 GMT the river Nene is in spate at well above its normal level (but still well below the levels achieved in the notorious floods of April 1998). The waterfall has effectively disappeared as the water level is the same both sides of the locks, the maximum amount of water being let through to ease the pressure in the upper parts of the catchment. Another 28.4 millimetres rainfall was recorded at Royston on this day! | Fields of oil seed rape have been a striking feature around Royston this Spring and have maintained maximum colour for most of the month of May. This photograph was taken from an elevated position on Hyde Hill to the east of Royston on 12th May 2012 at 0722 GMT looking westwards across the town. Royston has a rich variety of tree growth which shows up well in this view. Therfield Heath which is discernible in the background provides high ground protection to the west of the town, and with the ridge of higher ground just to the south of Royston, and the even higher land of the East Anglian Heights 4 km further south than this, it means the town is enclosed on three sides and open only to the South Cambridgeshire Plain to the north. At this time a wind of mean speed 4 knots gusting to 10 knots is rustling the oil seed rape in a temperature of 9.3°C. The maximum temperature achieved that day was very marginally under average at 16.2°C, after an overnight minimum temperature of 3.0°C, and a total of 10.9 hours sunshine was recorded. | This attractive tree on the corner of Garden Close and Poplar Drive in Royston is a reliable annual producer of blossom and is seen here at 1506 GMT on 25th May 2012. A significant feature of this picture is the clear sky as a fine and warm anticyclonic spell of weather which commenced just 3 days before on 22nd May is in complete contrast to the conditions of the first 3 weeks of May. By 21st May sunshine was running at only 50% of average for the period 1st/21st May, temperatures had been well below average, particularly by day, and rainfall well above average (despite being only minimal after 11th May)! A cloudless sky ensued all day and a sunshine total of 15.2 hours registered for the day. The next 2 days were similar with sunshine totals of 15.7 hours on both days. Temperatures climbed into the mid twenties °C in this warm spell, contrasting with daily maximum temperatures of 8-10°C for the 4 days 3rd to 6th May. The temperature at the time of the photograph was 23.9°C in a NE wind of 5 knots gusting to 13 knots. |
Return to Welcome to Royston (Iceni) Weather Station page
(This page last updated 8th June 2012 2023 GMT)