

Royston (Iceni) Weather Station
Daily Weather Observations - August 2012
(All Times GMT)
| Date | Max. Temp. (°C) 09/09h | Min. Temp. (°C) 09/09h | Grass Min. Temp. (°C) 21/09h | Earth (30cms) Temp. (°C) 09h | Sun (Hours) 00/00h | R'fall (MM) 09/09h | Wind Dir'n 09h | Mean Wind Speed (MPH) 00/00h | Max. Gust Speed (MPH) 00/00h | Cloud Cover (Oktas) 09h | Mean MSL Air Pressure (mB) 00/00h | Mean Rel. Humd. (%) 00/00h | Mean Temp. (°C) 00/00h | Fog (vis. <1000m @ 09h) | Fog (vis. <200m @ 09h) | Snow or Rain and Snow 00/00h | Snow Lying @ 09h (>50% cover) | Hail 00/00h | Thunder 00/00h | Date |
| 1 | 22.5 | 12.9 | 11.0 | 18.3 | 4.8 | 0.6 | S | 6.9 | 23 | 6 | 1007.9 | 82.6 | 17.5 | 0 | 0 | 0 | 0 | 0 | 0 | 1 |
| 2 | 22.1 | 14.2 | 12.2 | 18.2 | 4.5 | 0.6 | SW | 7.1 | 21 | 3 | 1008.9 | 81.7 | 16.9 | 0 | 0 | 0 | 0 | 0 | 0 | 2 |
| 3 | 22.7 | 12.0 | 10.0 | 18.4 | 10.3 | 0.5 | SW | 7.3 | 22 | 7 | 1010.9 | 75.8 | 16.9 | 0 | 0 | 0 | 0 | 0 | 0 | 3 |
| 4 | 21.6 | 12.9 | 10.9 | 18.4 | 7.1 | 2.0 | SW | 7.1 | 26 | 7 | 1008.4 | 80.3 | 16.6 | 0 | 0 | 0 | 0 | 0 | 1 | 4 |
| 5 | 21.3 | 12.4 | 10.6 | 18.4 | 6.0 | 0.8 | S | 4.7 | 20 | 8 | 1006.1 | 83.1 | 15.8 | 0 | 0 | 0 | 0 | 0 | 0 | 5 |
| 6 | 21.7 | 13.1 | 11.5 | 18.5 | 3.1 | 2.2 | W | 5.7 | 22 | 6 | 1008.2 | 82.6 | 16.2 | 0 | 0 | 0 | 0 | 0 | 0 | 6 |
| 7 | 21.6 | 11.1 | 9.0 | 18.5 | 4.8 | 2.0 | W | 6.9 | 25 | 8 | 1018.3 | 81.1 | 15.8 | 0 | 0 | 0 | 0 | 0 | 0 | 7 |
| 8 | 22.7 | 14.5 | 13.9 | 18.7 | 4.0 | 0.0 | NW | 2.9 | 11 | 8 | 1021.8 | 85.4 | 17.6 | 0 | 0 | 0 | 0 | 0 | 0 | 8 |
| 9 | 25.0 | 12.0 | 9.0 | 18.5 | 7.2 | 0.0 | S | 2.2 | 11 | 8 | 1025.2 | 77.6 | 18.0 | 0 | 0 | 0 | 0 | 0 | 0 | 9 |
| 10 | 26.7 | 12.1 | 9.4 | 19.0 | 13.6 | 0.0 | SW | 2.2 | 13 | 0 | 1025.4 | 76.2 | 18.5 | 0 | 0 | 0 | 0 | 0 | 0 | 10 |
| 11 | 23.7 | 11.1 | 10.0 | 19.5 | 8.6 | 0.0 | SE | 2.6 | 19 | 1 | 1020.2 | 77.6 | 16.9 | 0 | 0 | 0 | 0 | 0 | 0 | 11 |
| 12 | 25.8 | 12.5 | 9.5 | 19.4 | 9.3 | 0.0 | E | 3.5 | 21 | 2 | 1011.5 | 76.1 | 18.9 | 0 | 0 | 0 | 0 | 0 | 0 | 12 |
| 13 | 23.0 | 15.1 | 13.8 | 19.6 | 0.4 | 0.3 | SE | 5.7 | 17 | 7 | 1009.9 | 79.9 | 18.5 | 0 | 0 | 0 | 0 | 0 | 0 | 13 |
| 14 | 26.0 | 16.0 | 14.4 | 19.5 | 9.4 | 0.0 | S | 4.6 | 21 | 1 | 1010.1 | 76.2 | 20.0 | 0 | 0 | 0 | 0 | 0 | 0 | 14 |
| 15 | 23.5 | 16.1 | 13.1 | 19.9 | 2.3 | 1.1 | E | 5.4 | 29 | 8 | 1005.6 | 82.7 | 18.4 | 0 | 0 | 0 | 0 | 0 | 0 | 15 |
| 16 | 23.6 | 14.5 | 11.3 | 18.8 | 6.9 | 0.0 | SW | 7.7 | 25 | 5 | 1013.0 | 72.5 | 18.3 | 0 | 0 | 0 | 0 | 0 | 0 | 16 |
| 17 | 27.7 | 16.8 | 15.2 | 19.1 | 9.0 | 0.0 | S | 8.2 | 29 | 6 | 1012.4 | 65.1 | 21.6 | 0 | 0 | 0 | 0 | 0 | 0 | 17 |
| 18 | 31.4 | 19.3 | 16.8 | 19.9 | 12.8 | 0.0 | SW | 5.7 | 22 | 1 | 1012.7 | 65.8 | 24.2 | 0 | 0 | 0 | 0 | 0 | 0 | 18 |
| 19 | 30.0 | 16.7 | 14.0 | 20.7 | 10.2 | 0.0 | NE | 3.3 | 19 | 1 | 1014.2 | 75.8 | 22.7 | 0 | 0 | 0 | 0 | 0 | 0 | 19 |
| 20 | 24.5 | 15.6 | 12.9 | 20.8 | 4.9 | TR | S | 4.4 | 18 | 8 | 1018.1 | 79.2 | 19.4 | 0 | 0 | 0 | 0 | 0 | 0 | 20 |
| 21 | 23.2 | 15.2 | 12.6 | 20.0 | 1.1 | 0.0 | W | 4.6 | 23 | 8 | 1015.9 | 74.9 | 18.2 | 0 | 0 | 0 | 0 | 0 | 0 | 21 |
| 22 | 22.0 | 12.8 | 11.2 | 19.5 | 9.4 | 0.1 | SW | 8.8 | 28 | 4 | 1015.5 | 78.4 | 16.3 | 0 | 0 | 0 | 0 | 0 | 0 | 22 |
| 23 | 22.2 | 12.5 | 10.5 | 19.0 | 5.9 | 0.0 | W | 4.1 | 15 | 4 | 1012.7 | 73.4 | 16.7 | 0 | 0 | 0 | 0 | 0 | 0 | 23 |
| 24 | 21.2 | 13.1 | 11.5 | 19.1 | 3.1 | 4.3 | SW | 5.7 | 19 | 6 | 1003.5 | 75.2 | 16.8 | 0 | 0 | 0 | 0 | 0 | 0 | 24 |
| 25 | 21.6 | 14.8 | 13.3 | 19.0 | 4.2 | 4.5 | SW | 7.3 | 26 | 6 | 999.7 | 89.8 | 16.6 | 0 | 0 | 0 | 0 | 0 | 1 | 25 |
| 26 | 22.7 | 13.1 | 13.0 | 18.7 | 6.8 | 0.0 | W | 7.7 | 24 | 6 | 1013.6 | 76.9 | 16.3 | 0 | 0 | 0 | 0 | 0 | 0 | 26 |
| 27 | 20.3 | 11.5 | 10.0 | 18.5 | 3.3 | 1.2 | S | 7.5 | 27 | 7 | 1012.3 | 79.9 | 16.2 | 0 | 0 | 0 | 0 | 0 | 0 | 27 |
| 28 | 22.8 | 13.4 | 11.7 | 18.0 | 8.6 | 0.0 | W | 7.4 | 22 | 1 | 1011.5 | 77.5 | 17.5 | 0 | 0 | 0 | 0 | 0 | 0 | 28 |
| 29 | 18.8 | 13.1 | 11.8 | 18.0 | 3.9 | 7.6 | S | 7.8 | 25 | 7 | 1010.8 | 90.6 | 14.3 | 0 | 0 | 0 | 0 | 0 | 0 | 29 |
| 30 | 16.1 | 12.5 | 10.7 | 17.0 | 2.4 | 1.1 | W | 7.4 | 26 | 8 | 1016.0 | 88.4 | 12.6 | 0 | 0 | 0 | 0 | 0 | 0 | 30 |
| 31 | 18.9 | 4.7 | 2.0 | 15.9 | 9.2 | 0.2 | N | 5.1 | 18 | 0 | 1027.8 | 72.4 | 11.8 | 0 | 0 | 0 | 0 | 0 | 0 | 31 |
| Total/Mean | 23.1 | 13.5 | 11.5 | 18.9 | 197.0 | 29.1 | X | 5.7 | X | 5.1 | 1013.2 | 78.5 | 17.5 | 0 | 0 | 0 | 0 | 0 | 2 | Total/Mean |
| *Diff./% | +0.7 | +0.6 | 106% | 52% | *Diff./% | |||||||||||||||
| Date | Max. Temp. (°C) 09/09h | Min. Temp. (°C) 09/09h | Grass Min. Temp. (°C) 21/09h | Earth (30cms) Temp. (°C) 09h | Sun (Hours) 00/00h | R'fall (MM) 09/09h | Wind Dir'n 09h | Mean Wind Speed (MPH) 00/00h | Max. Gust Speed (MPH) 00/00h | Cloud Cover (Oktas) 09h | Mean MSL Air Pressure (mB) 00/00h | Mean Rel. Humd. (%) 00/00h | Mean Temp. (°C) 00/00h | Fog (vis. <1000m @ 09h) | Fog (vis. <200m @ 09h) | Snow or Rain and Snow 00/00h | Snow Lying @ 09h (>50% cover) | Hail 00/00h | Thunder 00/00h | Date |
Differences from average:
Differences from average shown in red. Reference periods used are as follows: Temperature 30 Years 1981/2010; rainfall 30 Years 1981/2010; sunshine 30 Years 1981/2010.
(*The differences from average quoted during the course of the month relate to the cumulative daily averages up to the date of the last observation, not the averages for the month as a whole)
Additional Data:
Rainfall Duration N/A
Air Frost Duration NIL hours
Graphs and Charts:
Click on the following links to view this month's graphs and charts.....
1. Daily Maximum, Minimum & Grass Minimum Temperatures
2. Daily Maximum & Minimum Temperatures (with 30 Year Comparative Means)
3. Daily Earth (30 cms Depth) Temperature @ 0900 GMT 4. Daily Rainfall 5. Daily Sunshine
6. Daily Maximum Gust & Mean Wind Speed 7. Daily Wind Direction @ 0900 GMT
8. Daily Mean MSL Air Pressure 9. Daily Mean Relative Humidity 10. Thermograph
11. Barograph 12. Hygrograph 13. Anemograph 14. Wind Direction
15. Rainfall Intensity & Duration
August 2012 Weather Review:
......and click on the link below for a text report of the August 2012 weather in Royston
August (since 1972) at Royston (Iceni) Weather Station:
Mean day maximum temperature (30 years 1981/2010) 22.4°C
Mean night minimum temperature (30 years 1981/2010) 12.9°C
Highest temperature 36.4°C (10th August 2003); lowest temperature 5.1°C (23rd August1993)
Lowest grass minimum temperature 1.0°C (23rd August1993)
Hottest August 1997 (Mean temperature 20.9°C); coolest August 1986 (Mean temperature 14.9°C)
Average August rainfall (30 years 1981/2010) 56.1 mm
Wettest August 2010 (Rainfall 149.3 mm); driest August 2003 (Rainfall 0.7 mm)
Wettest Day 6th August 2009 (Rainfall 52.4 mm)
Highest number of "rain days" (0.2 mm or more) 20 (2010); lowest number of "rain days" 1 (2003)
Highest number of days with thunder 6 (1999)
|
|
|
|
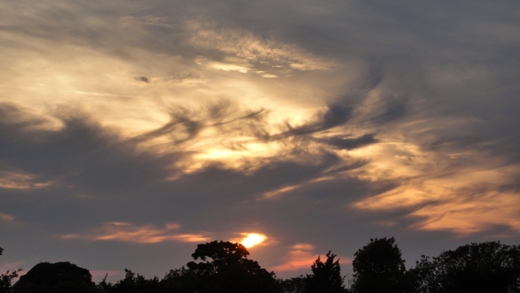
| Colourful sunsets have been infrequent in recent months and this one as seen from Royston at 1909 GMT on 11th August 2012 is rather subdued with little colour but nonetheless worthy of photographic capture. Up to this point in August the month had been dry and sunny although temperatures were lagging slightly below average. For the period 1st to 11th sunshine of 74.0 hours was 18% above average for this period, whilst rainfall was only 39% of average at 8.7 millimetres. Sunshine on 11th was 8.6 hours, following 13.6 hours on 10th, this likely to be the sunniest day of the month. At the time of this photograph an ENE breeze of mean speed 2 knots gusting to 4 knots was drifting across Royston in a temperature of 17.2°C. A maximum temperature of 23.7°C had been achieved earlier in the day (at 1155 GMT and 1325 GMT), this being 0.7°C above the average for 11th. The synoptic chart shows East Anglia under the influence of an anticyclone over Scandinavia at this time, whilst a band of showery rain is edging slowly north-eastwards over the south-west peninsula. | The wide expanse of arable land situated between the A505 and B1139 roads some 2.5 km E of Royston is featured in this view as seen (at 0729 GMT on 12th August 2012) from the B1139 mid-way between Royston and Barley. The A505 runs along the first line of trees in the middle distance whilst beyond is the ridge of higher ground running between Hyde Hill and Goffers Knoll. The harvest is underway and here the oilseed rape is being tackled first and as can be seen partially completed, with the wheat nearer to the camera waiting its turn. Conditions for harvesting are good at this time as this day had been preceded by 4 completely dry days. At the time the photograph was taken an ESE breeze of mean speed 1 knot gusting to 6 knots was providing early morning ventilation for drying the crops, in a temperature of 16.4°C and relative humidity of 90%, which reduced to a minimum of 47% at 1235 GMT. The maximum temperature for the day was 25.8°C, registered at 1315 GMT, and accumulated sunshine amounted to 9.3 hours by the end of the day. | This familiar landmark in the Royston area is the entrance to the stable block at Wimpole Hall (10 km N of Royston) as seen at 1358 GMT on 18th August 2012. In about 1842 the 4th Earl of Hardwicke had commissioned H. E. Kendall to design a new and larger stable block to replace the original 1690's stables which were situated nearer to the house. This modified design was then erected in 1852, these stables being a Victorian version of the late Stuart baroque. Today the stables provide welcoming facilities for visitors to the house, gardens, farm and park. This fine display of cirrus clouds has replaced the multiple contrails in the early morning skies over Royston as a cold front edges eastwards but becomes almost stationary over central England whilst on its eastern flank very hot air is being drawn northwards from Spain and France. The effect of this was that a maximum temperature of 31.4°C was experienced on 18th, the hottest day of the year to date (and likely to remain so given that in the 30 year means temperatures now gradually reduce until mid-February!). |
Return to Welcome to Royston (Iceni) Weather Station page
(This page last updated 11th September 2012 2034 GMT)