Royston (Iceni) Weather Station
Daily Weather Observations - February 2013
(All Times GMT)
| Date | Max. Temp. (°C) 09/09h | Min. Temp. (°C) 09/09h | Grass Min. Temp. (°C) 21/09h | Earth (30cms) Temp. (°C) 09h | Sun (Hours) 00/00h | R'fall (MM) 09/09h | Wind Dir'n 09h | Mean Wind Speed (MPH) 00/00h | Max. Gust Speed (MPH) 00/00h | Cloud Cover (Oktas) 09h | Mean MSL Air Pressure (mB) 00/00h | Mean Rel. Humd. (%) 00/00h | Mean Temp. (°C) 00/00h | Fog (vis. <1000m @ 09h) | Fog (vis. <200m @ 09h) | Snow or Rain and Snow 00/00h | Snow Lying @ 09h (>50% cover) | Hail 00/00h | Thunder 00/00h | Date |
| 1 | 7.0 | 4.5 | 3.9 | 5.4 | 3.9 | 0.0 | W | 7.3 | 30 | 8 | 1000.7 | 87.3 | 5.1 | 0 | 0 | 0 | 0 | 0 | 0 | 1 |
| 2 | 5.0 | 0.4 | -2.1 | 5.0 | 4.5 | 0.0 | NW | 8.6 | 26 | 1 | 1015.1 | 82.3 | 2.3 | 0 | 0 | 0 | 0 | 0 | 0 | 2 |
| 3 | 9.5 | -1.0 | -4.5 | 4.0 | 0.0 | 0.9 | SW | 10.8 | 36 | 8 | 1016.2 | 86.9 | 4.7 | 0 | 0 | 0 | 0 | 0 | 0 | 3 |
| 4 | 10.0 | 6.5 | 3.8 | 4.6 | 4.8 | 1.3 | W | 14.4 | 40 | 1 | 1009.4 | 78.3 | 7.6 | 0 | 0 | 0 | 0 | 0 | 0 | 4 |
| 5 | 5.7 | 1.0 | -1.3 | 4.6 | 5.7 | 1.4 | SW | 14.2 | 35 | 1 | 997.0 | 81.4 | 3.0 | 0 | 0 | 1 | 0 | 0 | 0 | 5 |
| 6 | 5.0 | 1.9 | -0.6 | 4.3 | 0.5 | 0.2 | NW | 10.3 | 34 | 8 | 1006.4 | 85.5 | 3.2 | 0 | 0 | 0 | 0 | 0 | 0 | 6 |
| 7 | 6.0 | -1.1 | -3.9 | 4.0 | 5.7 | 0.0 | NW | 7.3 | 19 | 1 | 1016.6 | 81.5 | 1.7 | 0 | 0 | 0 | 0 | 0 | 0 | 7 |
| 8 | 5.5 | -2.2 | -6.7 | 3.5 | 4.6 | 0.3 | W | 5.9 | 24 | 2 | 1018.5 | 88.8 | 1.3 | 0 | 0 | 0 | 0 | 0 | 0 | 8 |
| 9 | 4.1 | -0.1 | -2.9 | 3.4 | 2.5 | 2.2 | W | 3.9 | 14 | 6 | 1017.6 | 89.9 | 2.3 | 0 | 0 | 0 | 0 | 0 | 0 | 9 |
| 10 | 4.0 | 1.9 | 1.5 | 3.8 | 0.0 | 9.4 | SE | 7.8 | 33 | 8 | 998.9 | 95.8 | 2.3 | 0 | 0 | 1 | 0 | 0 | 0 | 10 |
| 11 | 0.9 | 0.0 | -0.2 | 3.7 | 0.0 | 0.2 | NE | 4.6 | 22 | 8 | 999.9 | 95.8 | 0.5 | 0 | 0 | 1 | 1 | 0 | 0 | 11 |
| 12 | 1.5 | 0.0 | -1.0 | 3.5 | 0.0 | 0.0 | NE | 2.8 | 14 | 8 | 1015.4 | 83.7 | 0.5 | 0 | 0 | 0 | 1 | 0 | 0 | 12 |
| 13 | 7.3 | -2.1 | -6.7 | 3.4 | 0.6 | 7.0 | SE | 7.1 | 35 | 8 | 1020.0 | 82.4 | 0.0 | 0 | 0 | 0 | 0 | 0 | 0 | 13 |
| 14 | 9.8 | 0.6 | 0.2 | 3.3 | 2.1 | 2.1 | W | 9.1 | 27 | 8 | 1009.9 | 93.1 | 5.8 | 0 | 0 | 0 | 0 | 0 | 0 | 14 |
| 15 | 10.0 | 2.7 | 0.0 | 4.0 | 5.3 | 0.0 | W | 6.7 | 23 | 7 | 1018.6 | 84.9 | 5.6 | 0 | 0 | 0 | 0 | 0 | 0 | 15 |
| 16 | 9.9 | 4.4 | 0.6 | 4.4 | 1.7 | 0.0 | NW | 3.0 | 11 | 7 | 1022.6 | 73.6 | 6.4 | 0 | 0 | 0 | 0 | 0 | 0 | 16 |
| 17 | 9.5 | 0.6 | -4.5 | 4.4 | 8.7 | 0.0 | S | 4.5 | 18 | 0 | 1021.3 | 84.9 | 3.7 | 0 | 0 | 0 | 0 | 0 | 0 | 17 |
| 18 | 6.7 | 0.1 | -4.3 | 4.0 | 6.9 | 0.0 | SE | 3.4 | 19 | 1 | 1020.1 | 87.4 | 3.4 | 0 | 0 | 0 | 0 | 0 | 0 | 18 |
| 19 | 9.5 | -2.4 | -7.2 | 3.8 | 9.3 | 0.1 | S | 2.4 | 12 | 0 | 1018.9 | 88.2 | 2.2 | 0 | 0 | 0 | 0 | 0 | 0 | 19 |
| 20 | 3.5 | 0.4 | -0.1 | 3.4 | 1.0 | 0.0 | E | 4.0 | 20 | 8 | 1023.5 | 83.5 | 2.0 | 0 | 0 | 0 | 0 | 0 | 0 | 20 |
| 21 | 1.6 | 0.3 | -0.6 | 3.5 | 0.0 | 0.0 | E | 4.8 | 21 | 8 | 1024.2 | 68.6 | 0.7 | 0 | 0 | 0 | 0 | 0 | 0 | 21 |
| 22 | 1.2 | -1.0 | -1.7 | 3.3 | 0.0 | TR | NE | 5.3 | 18 | 8 | 1020.8 | 74.1 | 0.0 | 0 | 0 | 1 | 0 | 0 | 0 | 22 |
| 23 | 2.1 | -1.0 | -1.8 | 3.1 | 0.1 | TR | NE | 4.1 | 16 | 8 | 1020.9 | 80.3 | 0.2 | 0 | 0 | 1 | 0 | 0 | 0 | 23 |
| 24 | 2.0 | -0.5 | -1.5 | 3.2 | 0.0 | 0.3 | N | 4.8 | 18 | 8 | 1023.8 | 83.7 | 0.5 | 0 | 0 | 1 | 0 | 0 | 0 | 24 |
| 25 | 3.6 | 0.5 | -0.3 | 3.1 | 0.0 | 0.2 | N | 6.2 | 27 | 8 | 1027.1 | 92.2 | 2.3 | 0 | 0 | 1 | 0 | 0 | 0 | 25 |
| 26 | 4.7 | 2.0 | 1.5 | 3.5 | 0.0 | 0.4 | NE | 5.8 | 18 | 8 | 1032.6 | 95.3 | 3.1 | 0 | 0 | 0 | 0 | 0 | 0 | 26 |
| 27 | 7.5 | 1.1 | 1.0 | 3.8 | 5.1 | 0.0 | NE | 5.6 | 17 | 8 | 1034.2 | 90.7 | 2.7 | 0 | 0 | 0 | 0 | 0 | 0 | 27 |
| 28 | 10.0 | 0.0 | -2.5 | 3.8 | 7.2 | 0.5 | NE | 5.5 | 20 | 8 | 1029.8 | 88.5 | 3.2 | 0 | 0 | 0 | 0 | 0 | 0 | 28 |
| Total/Mean | 5.8 | 0.6 | -1.5 | 3.9 | 80.1 | 26.5 | X | 6.4 | X | 5.8 | 1017.1 | 85.3 | 2.7 | 0 | 0 | 7 | 2 | 0 | 0 | Total/Mean |
| *Diff./% | -1.6 | -1.4 | 99% | 69% | *Diff./% | |||||||||||||||
| Date | Max. Temp. (°C) 09/09h | Min. Temp. (°C) 09/09h | Grass Min. Temp. (°C) 21/09h | Earth (30cms) Temp. (°C) 09h | Sun (Hours) 00/00h | R'fall (MM) 09/09h | Wind Dir'n 09h | Mean Wind Speed (MPH) 00/00h | Max. Gust Speed (MPH) 00/00h | Cloud Cover (Oktas) 09h | Mean MSL Air Pressure (mB) 00/00h | Mean Rel. Humd. (%) 00/00h | Mean Temp. (°C) 00/00h | Fog (vis. <1000m @ 09h) | Fog (vis. <200m @ 09h) | Snow or Rain and Snow 00/00h | Snow Lying @ 09h (>50% cover) | Hail 00/00h | Thunder 00/00h | Date |
Differences from average:
Differences from average shown in red. Reference periods used are as follows: Temperature 30 Years 1981/2010; rainfall 30 Years 1981/2010; sunshine 30 Years 1981/2010.
(*The differences from average quoted during the course of the month relate to the cumulative daily averages up to the date of the last observation, not the averages for the month as a whole)
Additional Data:
Rainfall Duration N/A
Air Frost Duration 78.5 hours
Graphs and Charts:
Click on the following links to view this month's graphs and charts.....
1. Daily Maximum, Minimum & Grass Minimum Temperatures
2. Daily Maximum & Minimum Temperatures (with 30 Year Comparative Means)
3. Daily Earth (30 cms Depth) Temperature @ 0900 GMT 4. Daily Rainfall 5. Daily Sunshine
6. Daily Maximum Gust & Mean Wind Speed 7. Daily Wind Direction @ 0900 GMT
8. Daily Mean MSL Air Pressure 9. Daily Mean Relative Humidity 10. Thermograph
11. Barograph 12. Hygrograph 13. Anemograph 14. Wind Direction
15. Rainfall Intensity & Duration
February 2013 Weather Review:
......and click on the link below for a text report of the February 2013 weather in Royston
February (since 1973) at Royston (Iceni) Weather Station:
Mean day maximum temperature (30 years 1981/2010) 7.4°C
Mean night minimum temperature (30 years 1981/2010) 2.0°C
Highest temperature 18.5°C (13th February 1998); lowest temperature -11.5°C (11th February 2012)
Lowest grass minimum temperature -15.3°C (11th February 2012)
Warmest February 1990 (Mean temperature 8.1°C); coldest February 1986 (Mean temperature -1.6°C)
Average February rainfall (30 years 1981/2010) 38.5 mm
Wettest February 2001 (Rainfall 90.7 mm); driest February 1998 (Rainfall 4.8 mm)
Wettest Day 7th February 2001 (Rainfall 21.8 mm);
Highest number of "rain days" (0.2 mm or more) 24 (2010); lowest number of "rain days" 5 (1998)
Highest number of days with thunder 2 (1995)
Highest number of air frosts 24 (1986)
Highest number of ground frosts 25 (1986)
Highest number of days with snow falling 15 (1986)
Highest number of days with snow lying (ground with more than 50% snow cover @ 0900 GMT) 23 (1986)
|
|
|
|
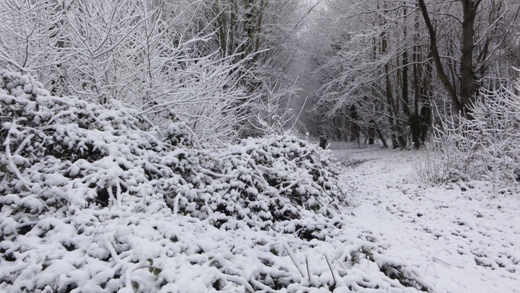
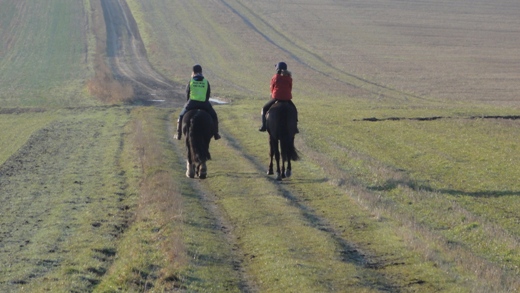
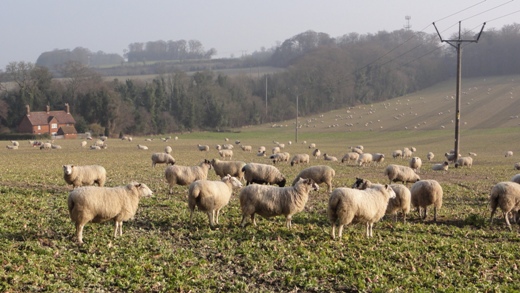
| By 1800 GMT on 10th February 2013 a low pressure system centred over Cardigan Bay had moved a series of fronts north-eastwards across the country, with the attendant precipitation falling in Royston as snow due to the fronts advancing into cold air which was lying over over the region. Amounts of snow falling were relatively small but had nonetheless created this scene at Burloes, Royston by the next morning (as seen at 0934 GMT). The woodland in the background was replanted and has largely regenerated after being mostly destroyed in the severe storm of 16th October 1987. This particular snowfall was very altitude sensitive with the lower parts of the town exhibiting little settled snow whereas on the higher areas the snow settled readily as at this location. At this time the wind direction was NE and the wind of mean speed 5 knots gusting to 10 knots. The temperature remained fairly constant that day, being 0.3°C at the time of the photograph, after an overnight minimum of 0.0°C, and later rising to a maximum of 0.9°C. A significant factor contributing to the muted temperature rise was undoubtedly the complete absence of any sunshine during the day. No sunshine was recorded on the following two days either. | Despite being located in an area of essentially arable farming, Royston has a long association with horses and there has been a tradition of racing in the area going back centuries. Therfield Heath adjacent to the town is a key location for horse gallops and there is mention of horse racing taking place on the Heath in the time of King James I. Racing stables are currently situated on the Heath towards its western end, and until the 1980s a racing stable was located in the town itself, just a few metres from the town centre but with direct access to the Heath. In recent years the land to the south of the town leading up to the East Anglian Heights has been populated with with new stabling facilities and enclosures, whilst only 5 km to the S is the Newsells Park Stud. In this photograph taken at 0833 GMT on 17th February 2013 in open country to the E of Royston two young riders are enjoying an early morning canter as the low rising sun casts long shadows across the landscape. The temperature is only 0.9°C but the S wind currently directly faced by the riders is relatively light at mean speed 4 knots gusting to 7 knots. The early morning sunshine lasted most of the day and registered 8.7 hours for the day, making it the sunniest day of the year so far. | In this scenario sheep are capable of easily co-existing with arable farming as they are able to feed on a green crop grown after the cereal harvest of the previous Summer, and then move on before the land is required for ploughing, and sowing for the the current year's harvest. In this picture taken on 18th February 2013 at 0920 GMT the sheep in the foreground have recently been transferred in from another nearby field on the Burloes estate where they had exhausted the crop, whilst the original flock populating this field can just be discerned in the distance. Additional feed is also brought in for the sheep to supplement the visible crop. This view is looking NE from the southern end of Bury Plantation to Hyde Hill in the distance, whilst the line of trees in the middle distance borders the Newmarket Road embankment as this road climbs out of the town. This day was the middle day of an isolated 3 day spell which registered almost 25 hours sunshine, due to the ridge of high pressure over the country extending from anticyclones over Europe to the E and NE. The wind direction was SE at this time, and of mean speed 2 knots gusting to 7 knots. The temperature was 2.8°C, later rising to a maximum for the day of 6.7 °C. |
Return to Welcome to Royston (Iceni) Weather Station page
(This page last updated 11th March 2013 2046 GMT)